29
/es/
es
AIzaSyAYiBZKx7MnpbEhh9jyipgxe19OcubqV5w
April 1, 2024
247393
Spain
ESP
true
2
1
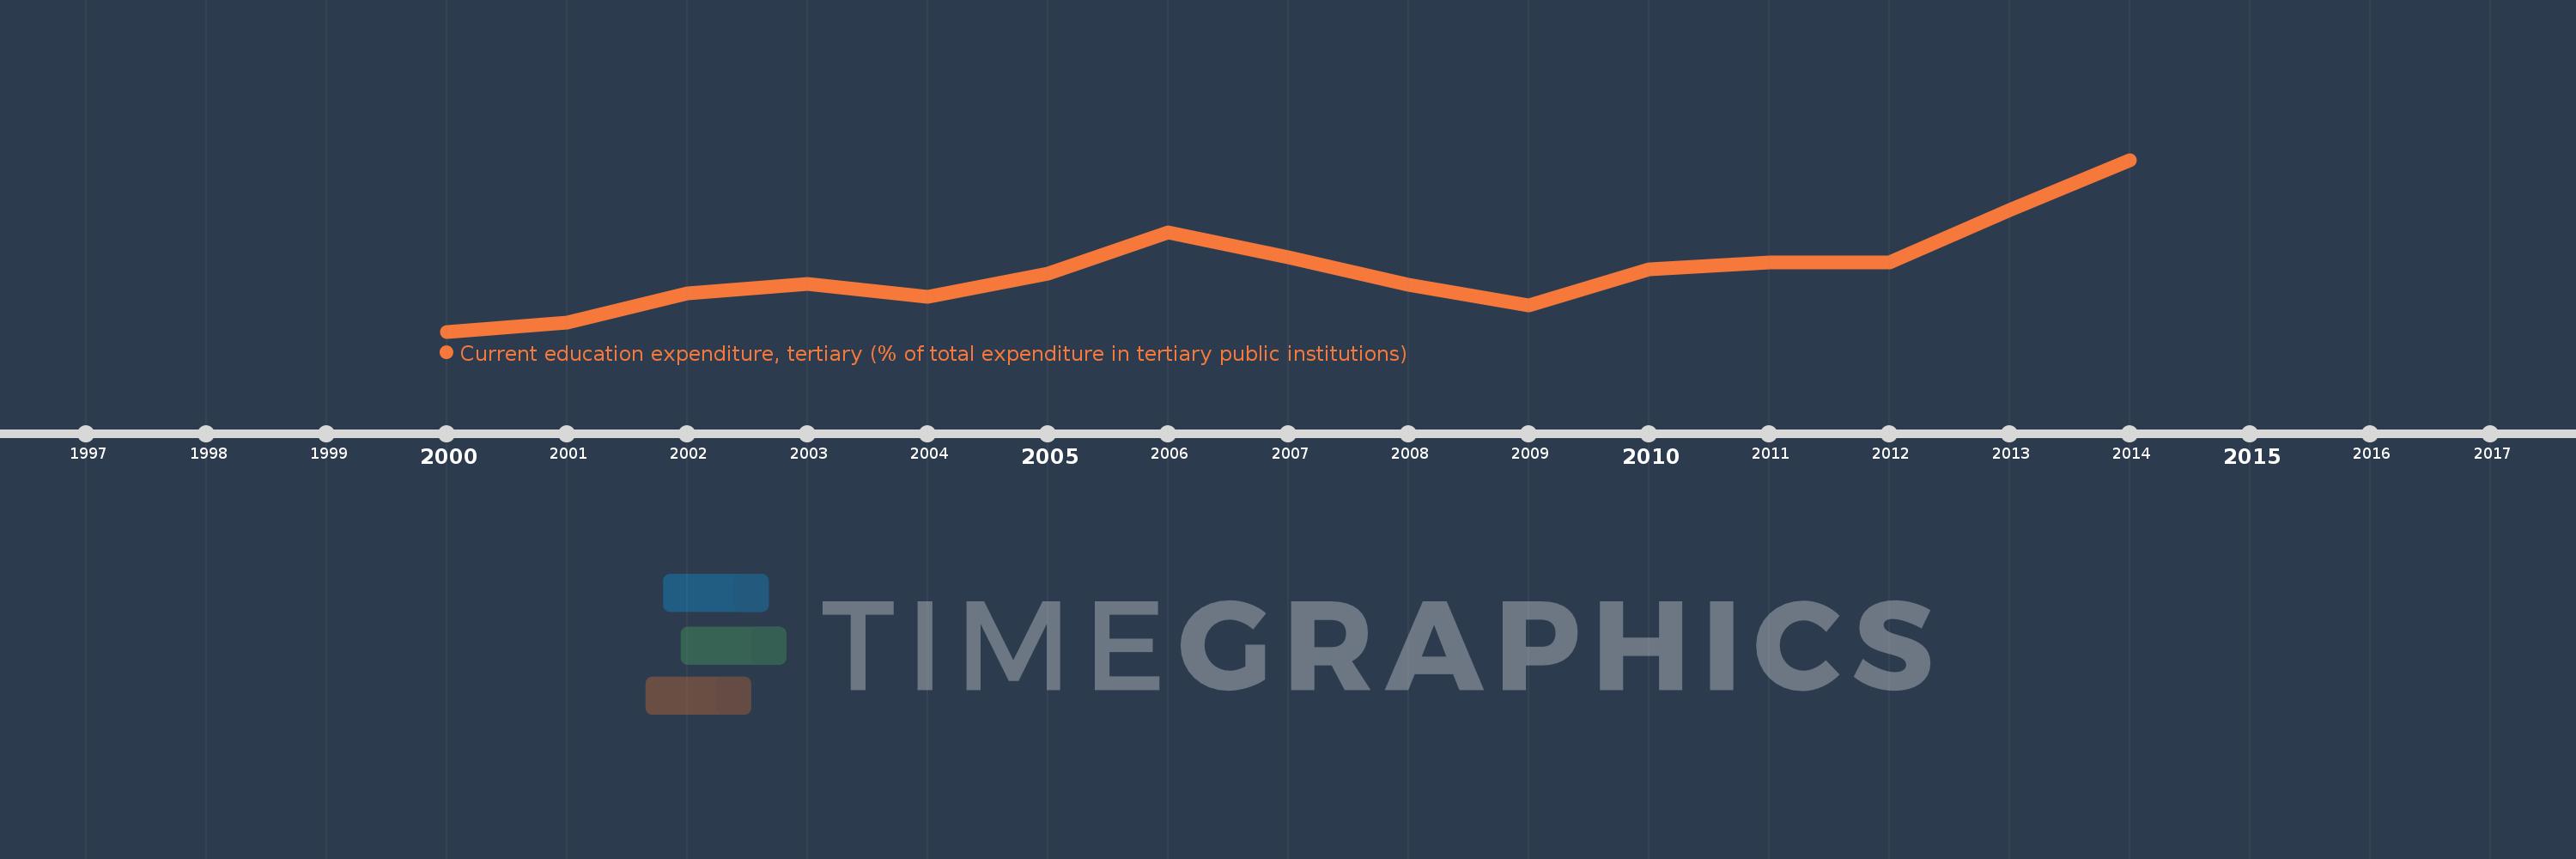
Current education expenditure, tertiary (% of total expenditure in tertiary public institutions)
2014,2013,2012,2011,2010,2009,2008,2007,2006,2005,2004,2003,2002,2001,2000
Estas estadísticas en otros países:
línea de tiempo (timeline):
En esta escala de tiempo se presenta un gráfico de 2000 y 2014 de Spain. Los datos de 1999 están ausentes. El número de observaciones reales por fecha: 15.
Fuente (nombre):
Indicadores del desarrollo mundial
Fuente (organización):
United Nations Educational, Scientific, and Cultural Organization (UNESCO) Institute for Statistics.
Categorías:
Education
Se ha actualizado:
23 abr 2017 año
Los indicadores de los cambios de valor en los últimos años
Mínimo:
77.989
1 ene 2000 año
Máximo:
86.932
1 ene 2014 año
A la fecha de observación
Valor
Cambio absoluto
El cambio con respecto al valor anterior
1 ene 2000 año
77.989
+77.989
0.0%
1 ene 2001 año
78.438
+0.449
0.58%
1 ene 2002 año
79.982
+1.544
1.97%
1 ene 2003 año
80.488
+0.506
0.63%
1 ene 2004 año
79.796
-0.692
-0.86%
1 ene 2005 año
80.992
+1.196
1.5%
1 ene 2006 año
83.157
+2.165
2.67%
1 ene 2007 año
81.857
-1.3
-1.56%
1 ene 2008 año
80.413
-1.444
-1.76%
1 ene 2009 año
79.359
-1.054
-1.31%
1 ene 2010 año
81.217
+1.858
2.34%
1 ene 2011 año
81.58
+0.364
0.45%
1 ene 2012 año
81.58
0.0
0.0%
1 ene 2013 año
84.33
+2.749
3.37%
1 ene 2014 año
86.932
+2.602
3.09%
Ranking de los países por los datos estadísticos actuales


Comentarios: