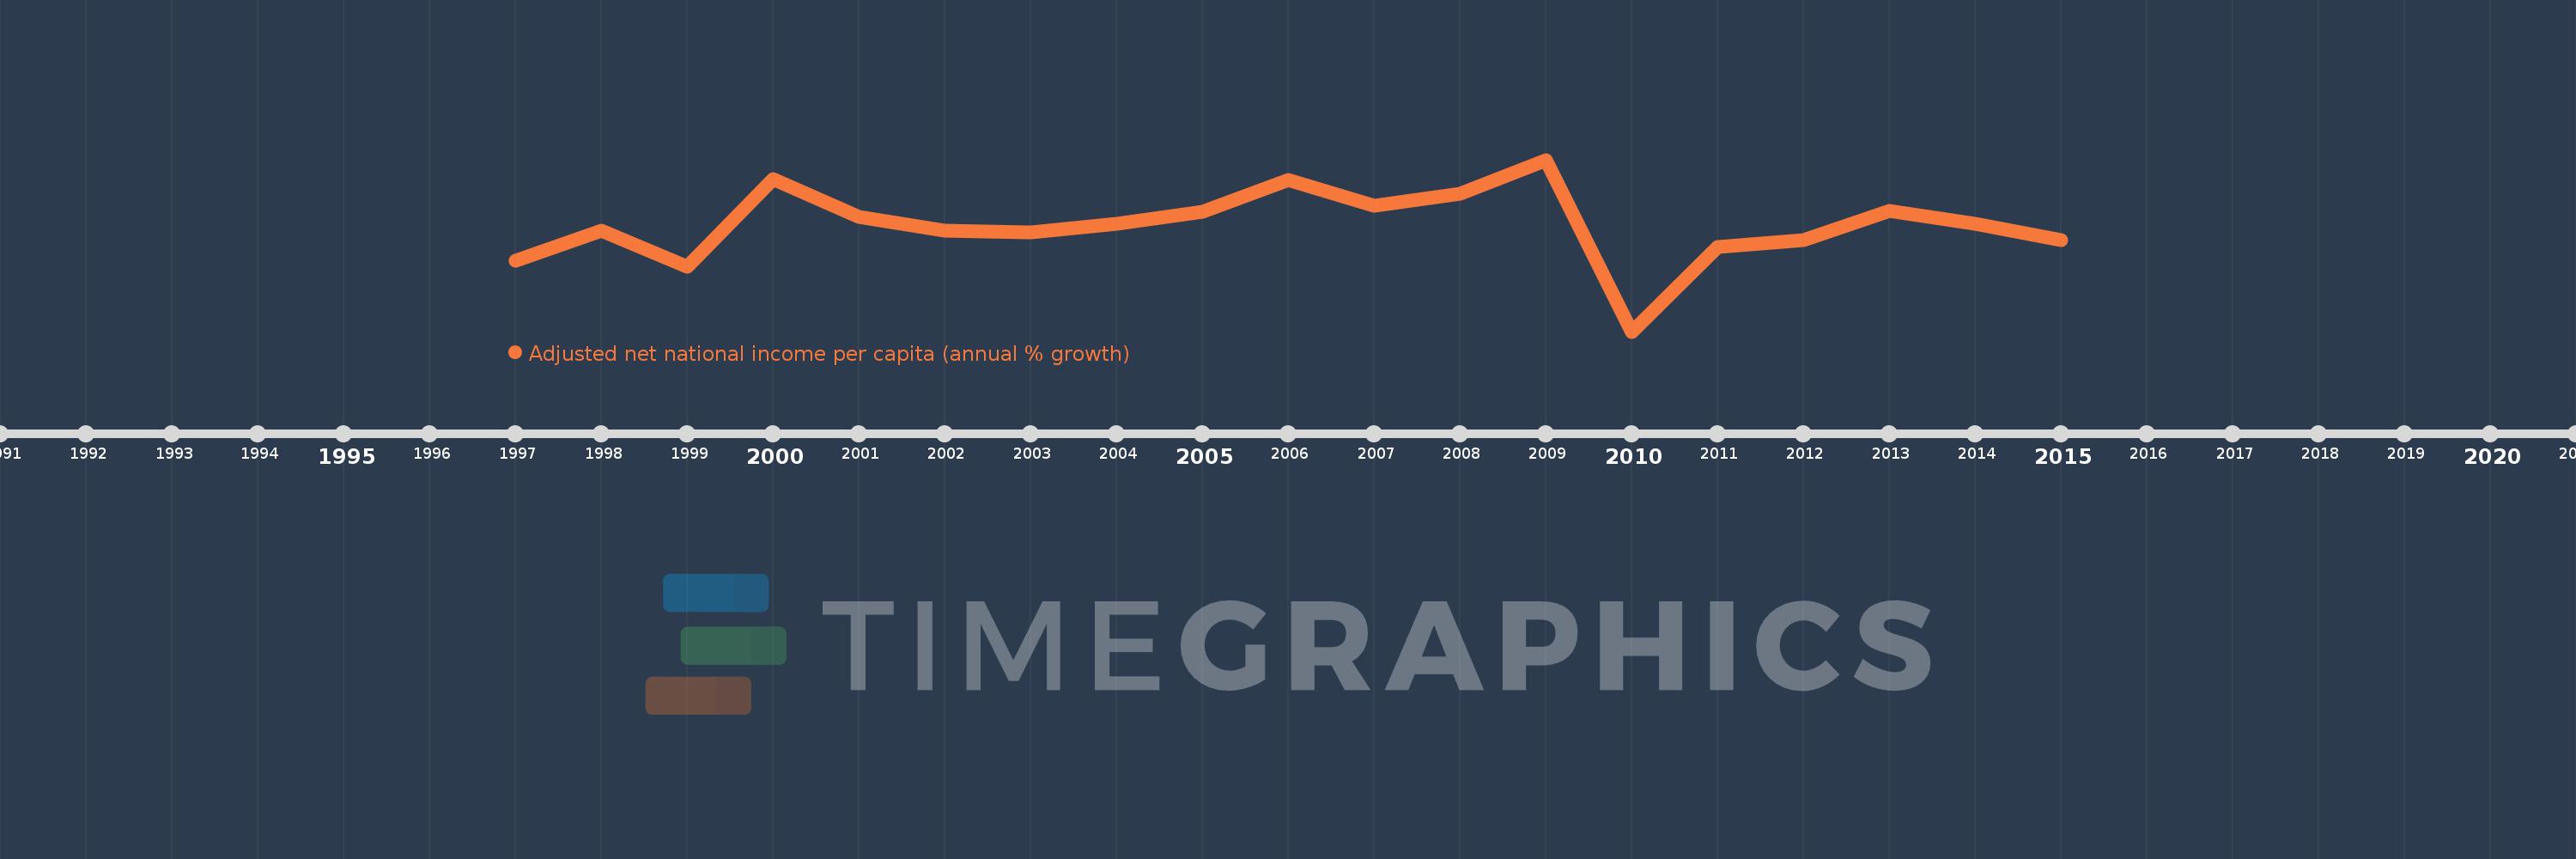
This timeline shows a graph from 1997 to 2015 of Cambodia. No data until 1996. Number of actual observations by date: 19.
Source name:
World Development Indicators
Source organization:
World Bank staff estimates based on sources and methods in World Bank's "The Changing Wealth of Nations: Measuring Sustainable Development in the New Millennium" (2011).
Categories, topics:
Economy & Growth
Last updated:
apr 23, 2017
Indicators value changes by year
Meaning:
6.212
Minimum:
-8.236
jan 1, 2010
Maximum:
15.187
jan 1, 2009
At the date of observation
Value
Absolute change
Change from the previous value
jan 1, 1997
1.445
+1.445
0.0%
jan 1, 1998
5.524
+4.079
282.38%
jan 1, 1999
0.658
-4.866
-88.09%
jan 1, 2000
12.59
+11.932
1.81K%
jan 1, 2001
7.412
-5.178
-41.13%
jan 1, 2002
5.526
-1.886
-25.45%
jan 1, 2003
5.257
-0.269
-4.87%
jan 1, 2004
6.405
+1.148
21.84%
jan 1, 2005
8.072
+1.668
26.04%
jan 1, 2006
12.488
+4.415
54.7%
jan 1, 2007
8.873
-3.614
-28.94%
jan 1, 2008
10.514
+1.641
18.49%
jan 1, 2009
15.187
+4.673
44.45%
jan 1, 2010
-8.236
-23.424
-154.23%
jan 1, 2011
3.257
+11.493
-139.54%
jan 1, 2012
4.183
+0.926
28.45%
jan 1, 2013
8.184
+4.001
95.64%
jan 1, 2014
6.477
-1.707
-20.85%
jan 1, 2015
4.214
-2.263
-34.94%
Ranking of countries by current statistics by years