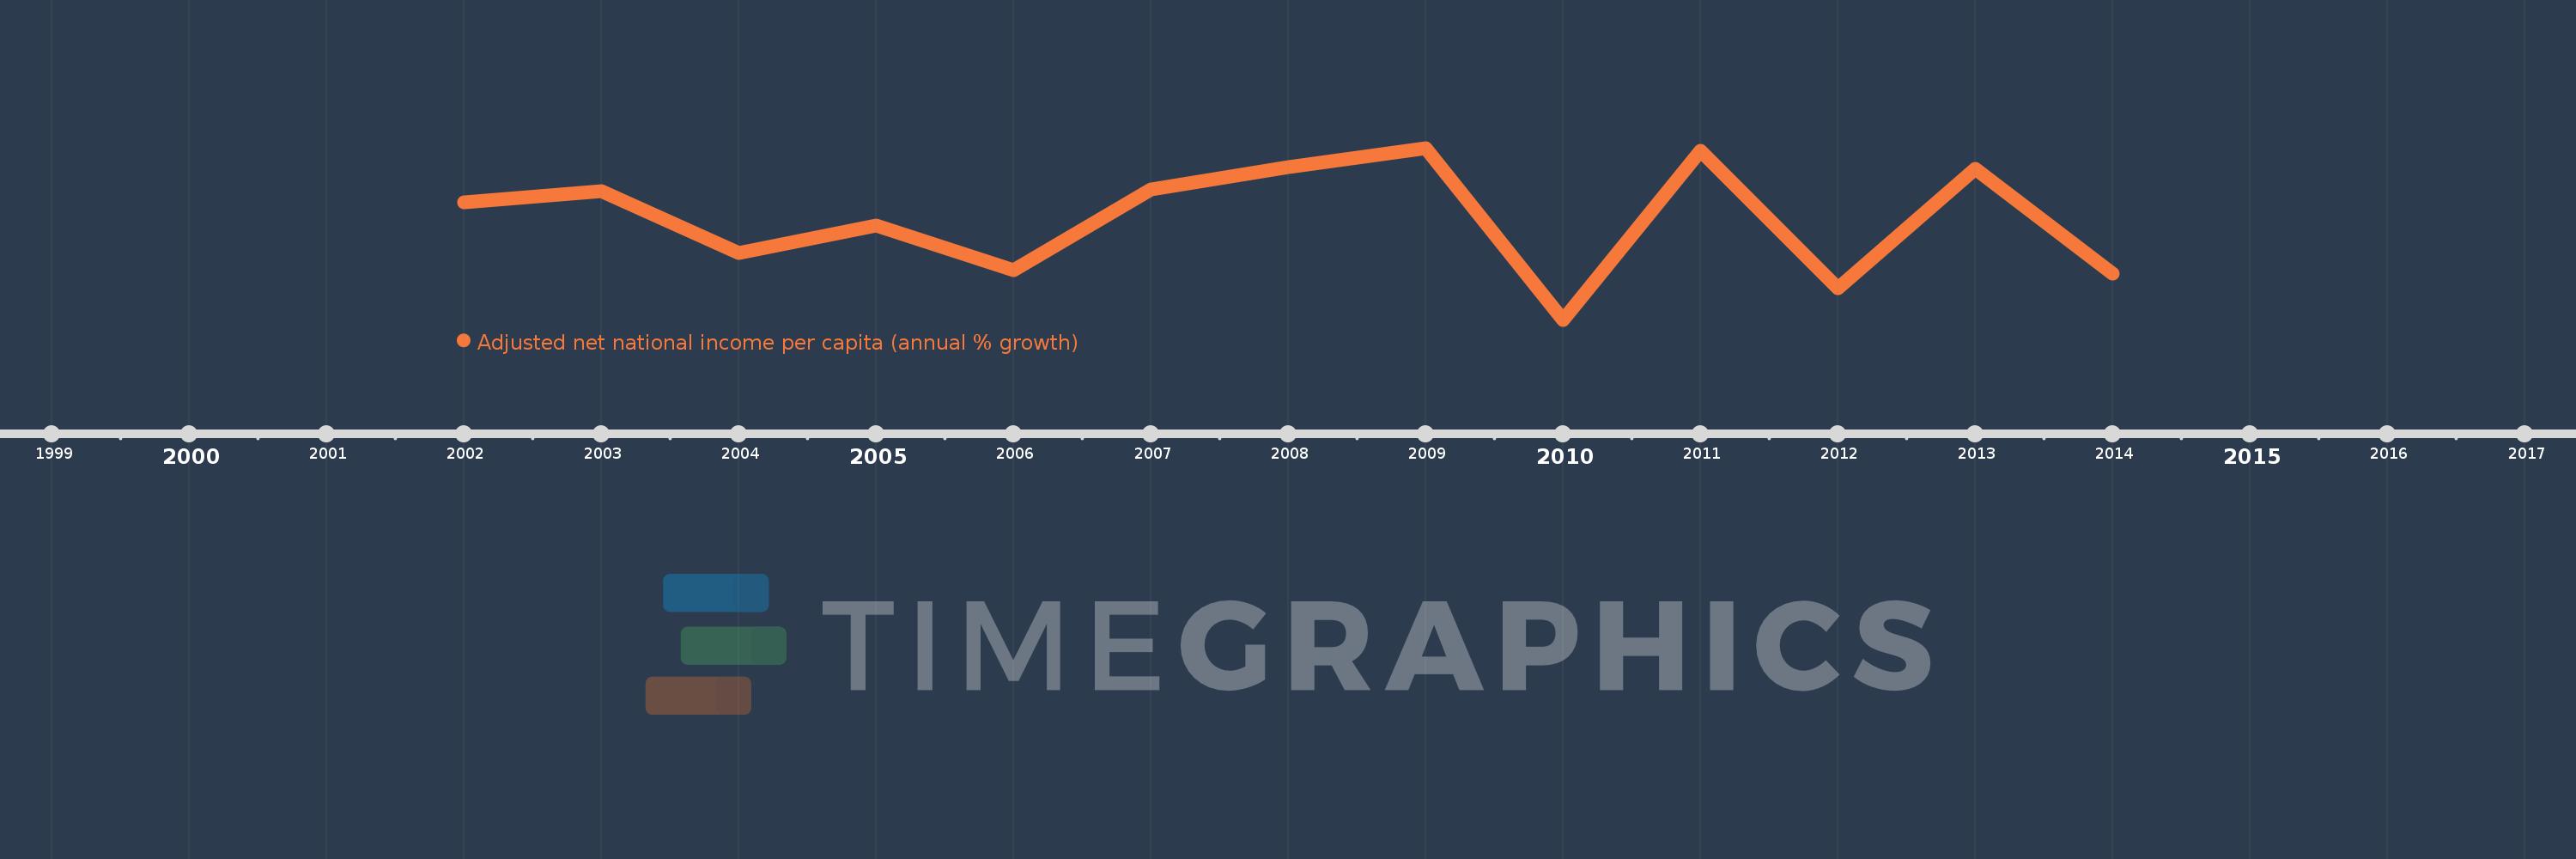
This timeline shows a graph from 2002 to 2014 of Oman. No data until 2001. Number of actual observations by date: 13.
Source name:
World Development Indicators
Source organization:
World Bank staff estimates based on sources and methods in World Bank's "The Changing Wealth of Nations: Measuring Sustainable Development in the New Millennium" (2011).
Categories, topics:
Economy & Growth
Last updated:
apr 23, 2017
Indicators value changes by year
Meaning:
2.552
Minimum:
-17.172
jan 1, 2010
Maximum:
16.448
jan 1, 2009
At the date of observation
Value
Absolute change
Change from the previous value
jan 1, 2002
5.78
+5.78
0.0%
jan 1, 2003
8.036
+2.256
39.04%
jan 1, 2004
-4.068
-12.104
-150.62%
jan 1, 2005
1.242
+5.31
-130.52%
jan 1, 2006
-7.461
-8.702
-700.87%
jan 1, 2007
8.408
+15.868
-212.7%
jan 1, 2008
12.768
+4.361
51.86%
jan 1, 2009
16.448
+3.679
28.82%
jan 1, 2010
-17.172
-33.62
-204.4%
jan 1, 2011
15.896
+33.068
-192.57%
jan 1, 2012
-10.966
-26.862
-168.98%
jan 1, 2013
12.396
+23.362
-213.04%
jan 1, 2014
-8.137
-20.533
-165.64%
Ranking of countries by current statistics by years