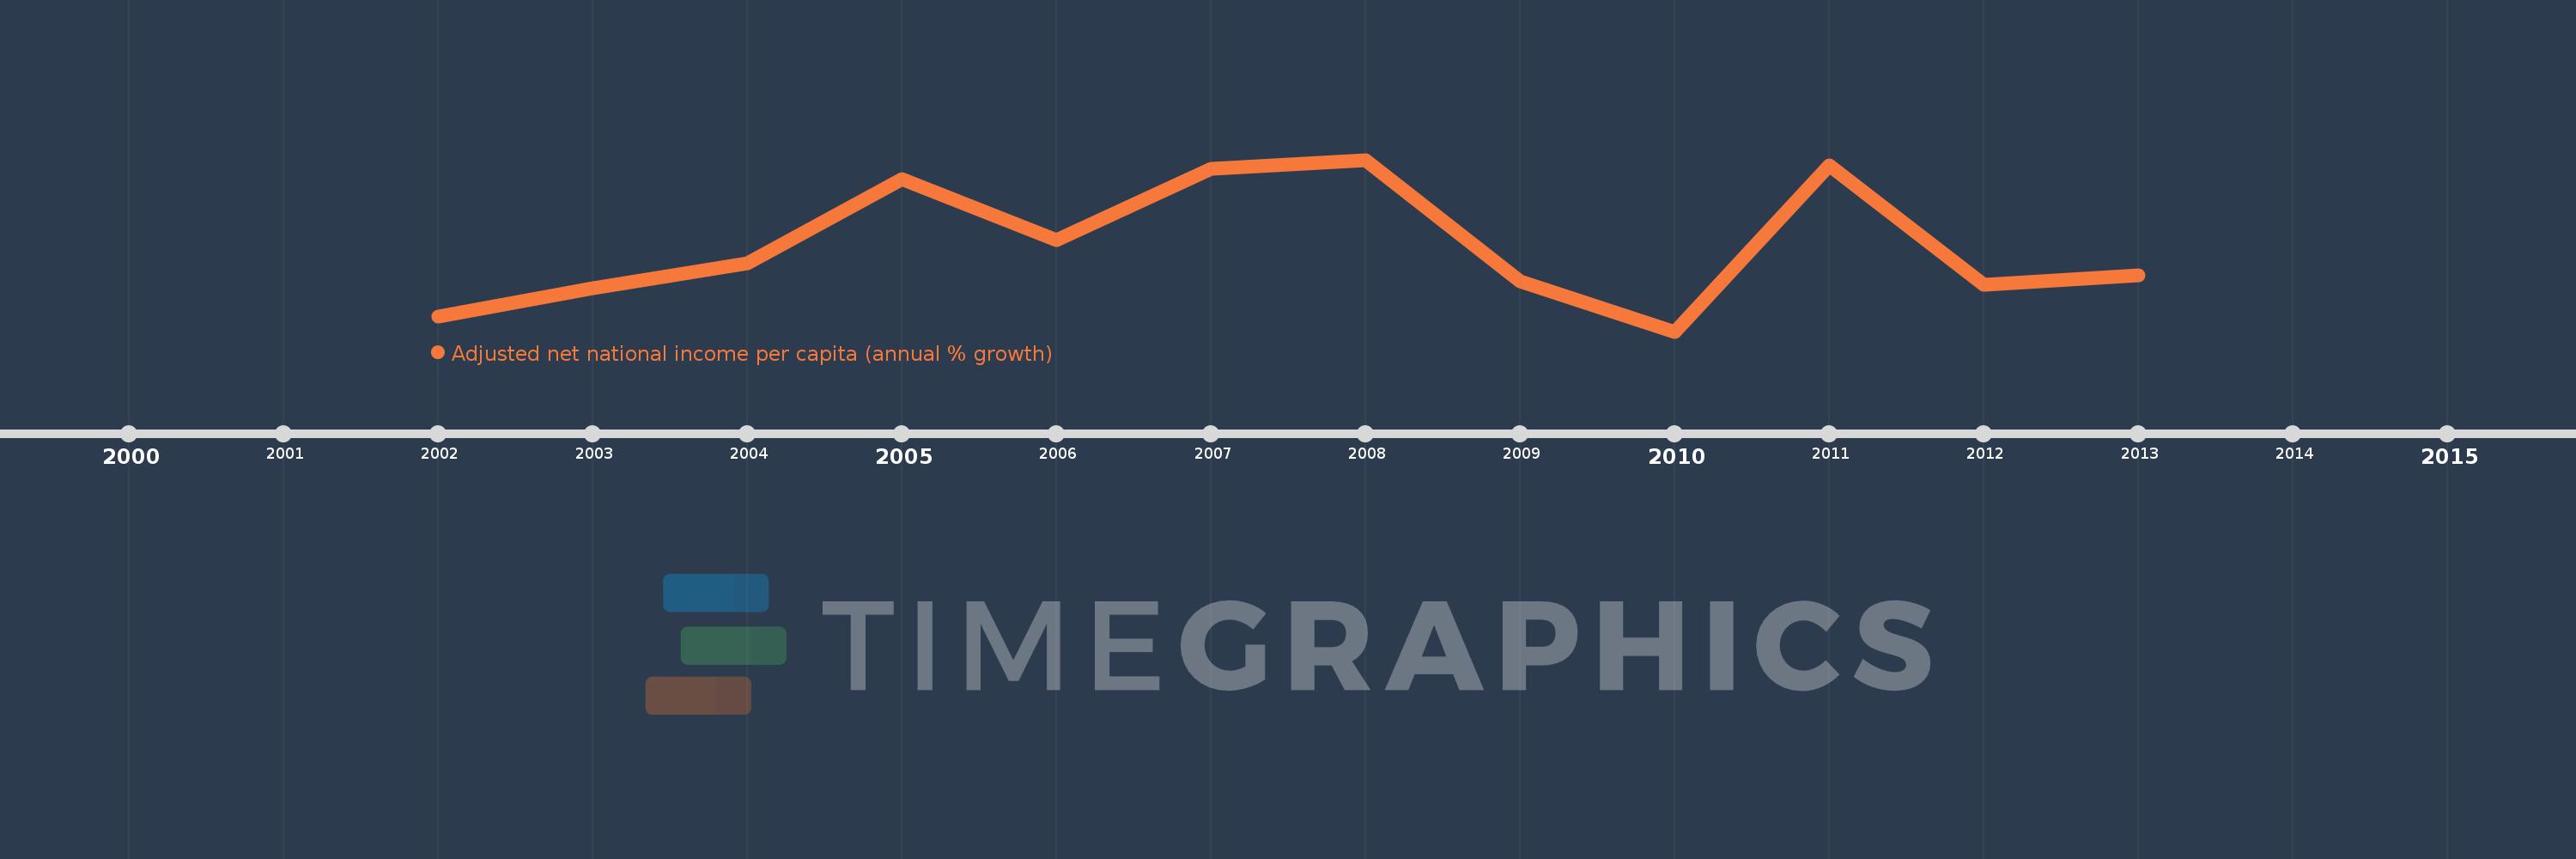
This timeline shows a graph from 2002 to 2013 of Middle income. No data until 2001. Number of actual observations by date: 12.
Source name:
World Development Indicators
Source organization:
World Bank staff estimates based on sources and methods in World Bank's "The Changing Wealth of Nations: Measuring Sustainable Development in the New Millennium" (2011).
Categories, topics:
Economy & Growth
Last updated:
apr 23, 2017
Indicators value changes by year
Meaning:
3.703
Minimum:
-0.085
jan 1, 2010
Maximum:
7.529
jan 1, 2008
At the date of observation
Value
Absolute change
Change from the previous value
jan 1, 2002
0.592
+0.592
0.0%
jan 1, 2003
1.848
+1.257
212.49%
jan 1, 2004
2.94
+1.092
59.05%
jan 1, 2005
6.687
+3.747
127.44%
jan 1, 2006
3.951
-2.736
-40.91%
jan 1, 2007
7.121
+3.17
80.23%
jan 1, 2008
7.529
+0.407
5.72%
jan 1, 2009
2.154
-5.374
-71.39%
jan 1, 2010
-0.085
-2.239
-103.92%
jan 1, 2011
7.293
+7.377
-8.73K%
jan 1, 2012
1.977
-5.316
-72.89%
jan 1, 2013
2.423
+0.447
22.59%
Ranking of countries by current statistics by years