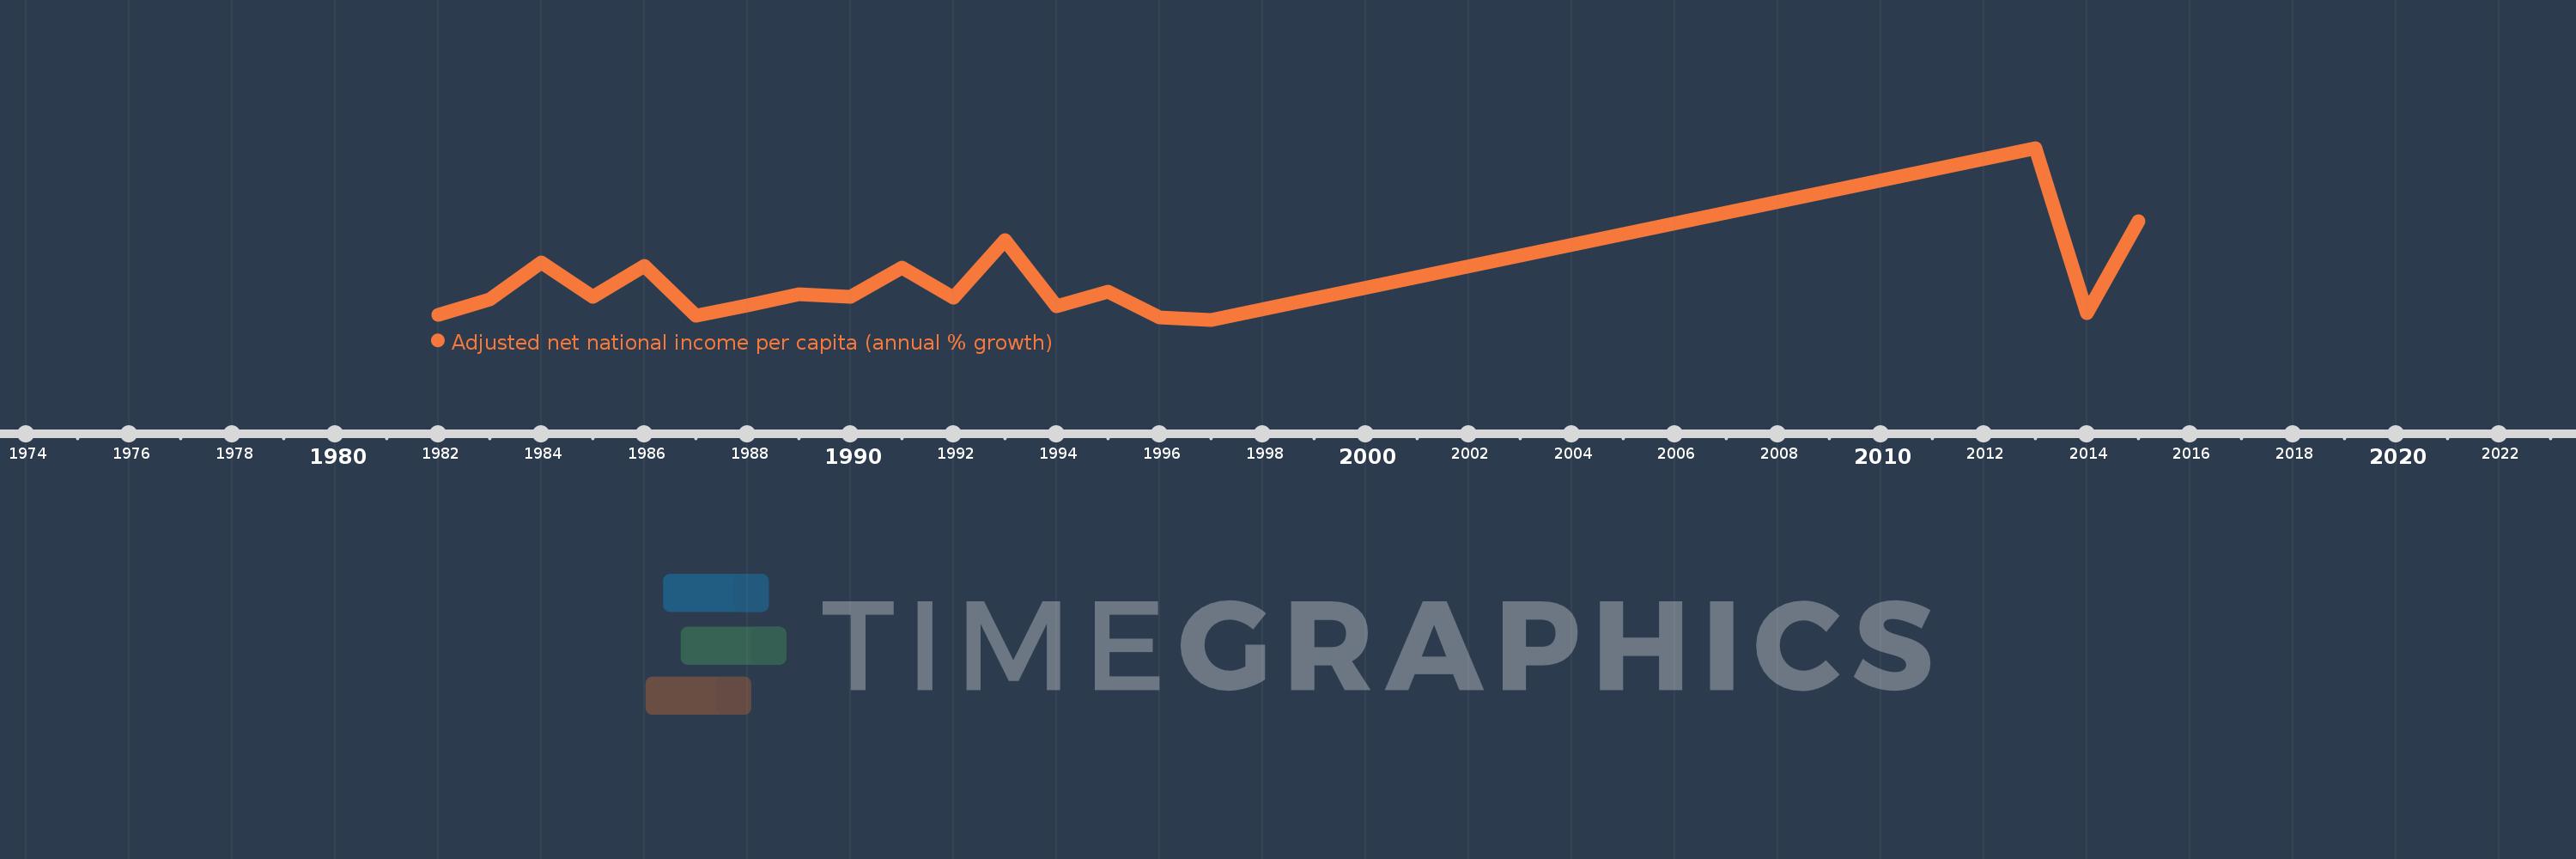
This timeline shows a graph from 1982 to 2015 of Equatorial Guinea. No data until 1981. Number of actual observations by date: 19.
Source name:
World Development Indicators
Source organization:
World Bank staff estimates based on sources and methods in World Bank's "The Changing Wealth of Nations: Measuring Sustainable Development in the New Millennium" (2011).
Categories, topics:
Economy & Growth
Last updated:
apr 23, 2017
Indicators value changes by year
Meaning:
5.882
Minimum:
-23.091
jan 1, 1997
Maximum:
112.134
jan 1, 2013
At the date of observation
Value
Absolute change
Change from the previous value
jan 1, 1982
-19.056
-19.056
0.0%
jan 1, 1983
-7.082
+11.974
-62.83%
jan 1, 1984
21.826
+28.908
-408.17%
jan 1, 1985
-4.96
-26.785
-122.72%
jan 1, 1986
19.158
+24.118
-486.28%
jan 1, 1987
-19.601
-38.76
-202.31%
jan 1, 1988
-11.893
+7.709
-39.33%
jan 1, 1989
-3.348
+8.544
-71.85%
jan 1, 1990
-5.032
-1.684
50.29%
jan 1, 1991
18.104
+23.136
-459.78%
jan 1, 1992
-5.941
-24.045
-132.81%
jan 1, 1993
39.338
+45.279
-762.19%
jan 1, 1994
-12.474
-51.812
-131.71%
jan 1, 1995
-1.093
+11.381
-91.24%
jan 1, 1996
-21.567
-20.474
1.87K%
jan 1, 1997
-23.091
-1.525
7.07%
jan 1, 2013
112.134
+135.225
-585.61%
jan 1, 2014
-17.882
-130.015
-115.95%
jan 1, 2015
54.226
+72.108
-403.25%
Ranking of countries by current statistics by years