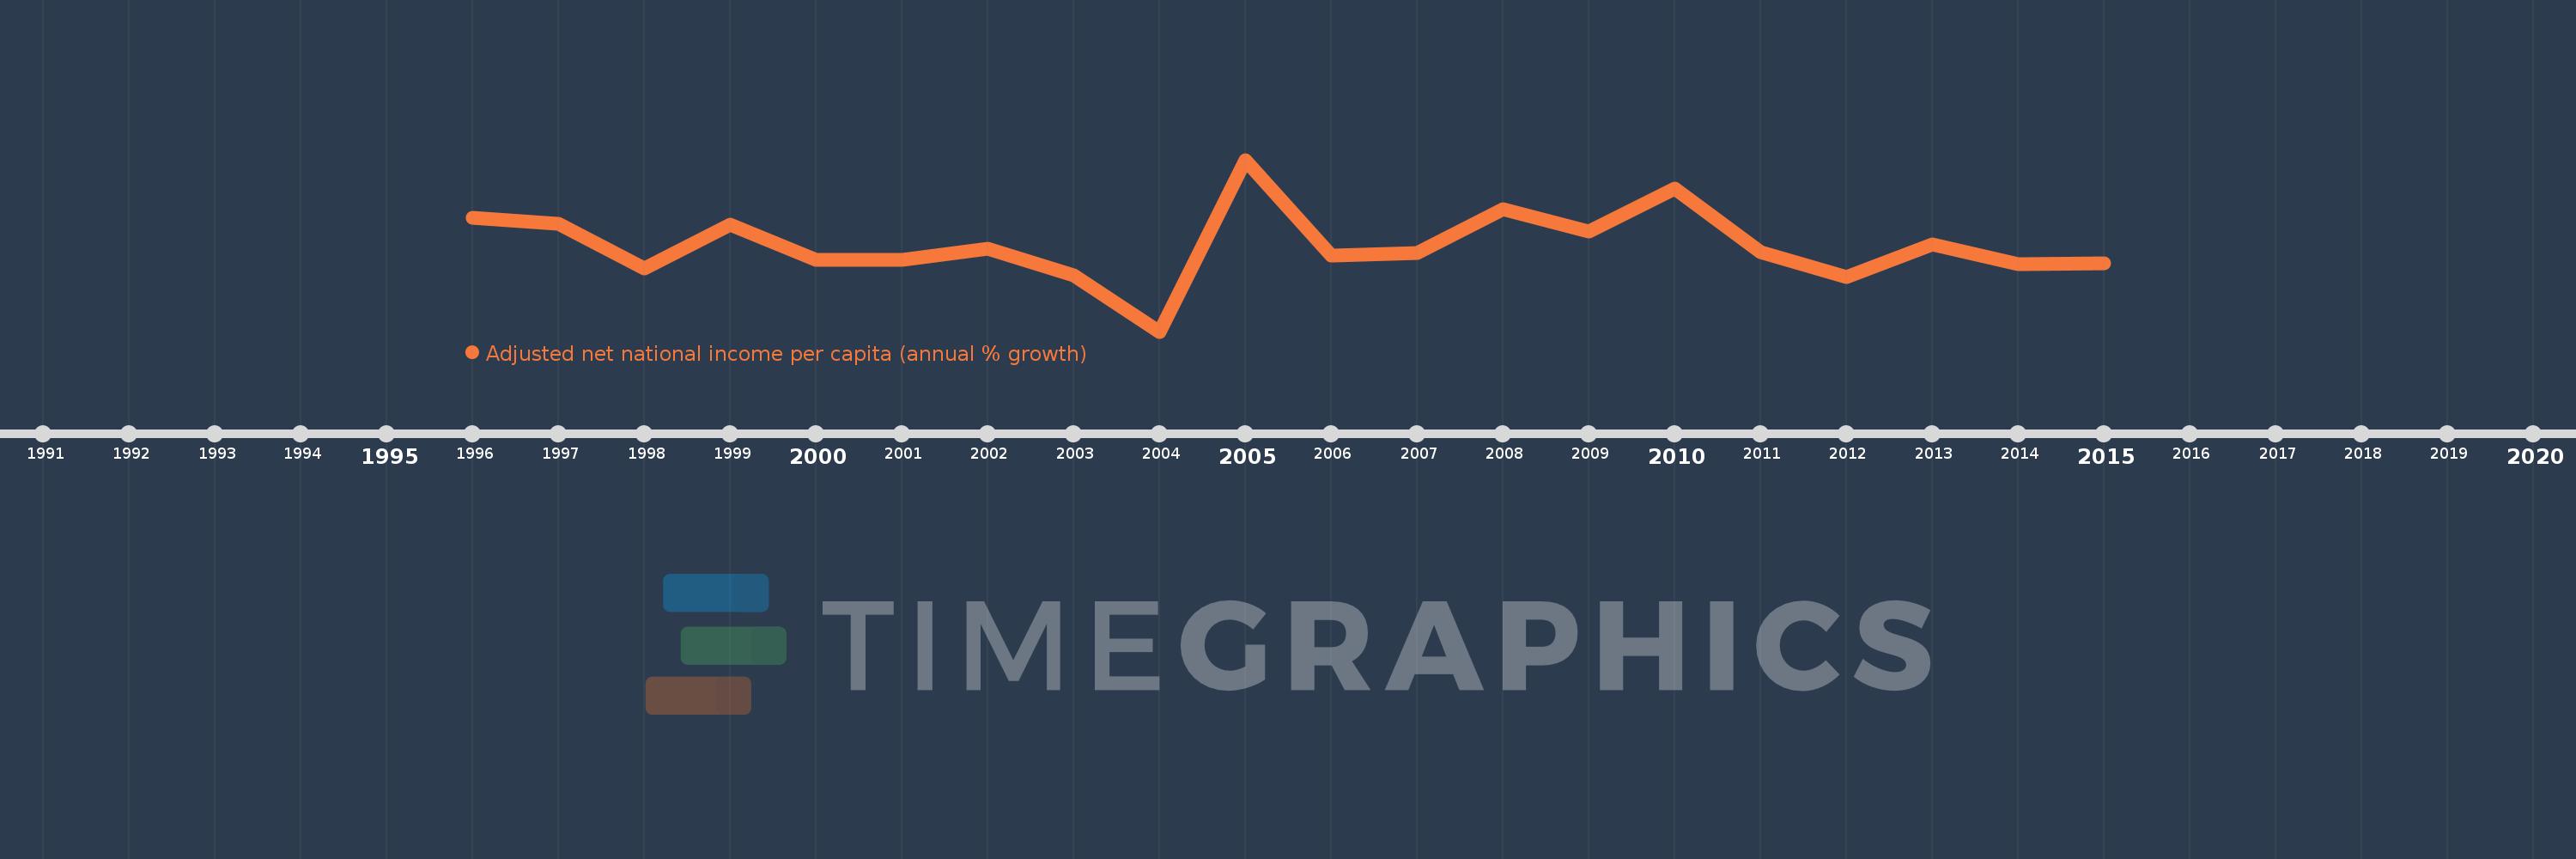
This timeline shows a graph from 1996 to 2015 of Lebanon. No data until 1995. Number of actual observations by date: 20.
Source name:
World Development Indicators
Source organization:
World Bank staff estimates based on sources and methods in World Bank's "The Changing Wealth of Nations: Measuring Sustainable Development in the New Millennium" (2011).
Categories, topics:
Economy & Growth
Last updated:
apr 23, 2017
Indicators value changes by year
Meaning:
2.048
Minimum:
-17.532
jan 1, 2004
Maximum:
21.492
jan 1, 2005
At the date of observation
Value
Absolute change
Change from the previous value
jan 1, 1996
8.38
+8.38
0.0%
jan 1, 1997
6.945
-1.435
-17.12%
jan 1, 1998
-3.102
-10.048
-144.67%
jan 1, 1999
6.752
+9.855
-317.65%
jan 1, 2000
-1.201
-7.953
-117.78%
jan 1, 2001
-1.265
-0.064
5.34%
jan 1, 2002
1.223
+2.488
-196.64%
jan 1, 2003
-4.679
-5.901
-482.73%
jan 1, 2004
-17.532
-12.853
274.69%
jan 1, 2005
21.492
+39.024
-222.59%
jan 1, 2006
-0.348
-21.84
-101.62%
jan 1, 2007
0.262
+0.609
-175.24%
jan 1, 2008
10.326
+10.064
3.85K%
jan 1, 2009
5.286
-5.039
-48.8%
jan 1, 2010
15.035
+9.749
184.41%
jan 1, 2011
0.568
-14.467
-96.22%
jan 1, 2012
-5.15
-5.718
-1.01K%
jan 1, 2013
2.346
+7.496
-145.55%
jan 1, 2014
-2.298
-4.644
-197.98%
jan 1, 2015
-2.082
+0.216
-9.4%
Ranking of countries by current statistics by years