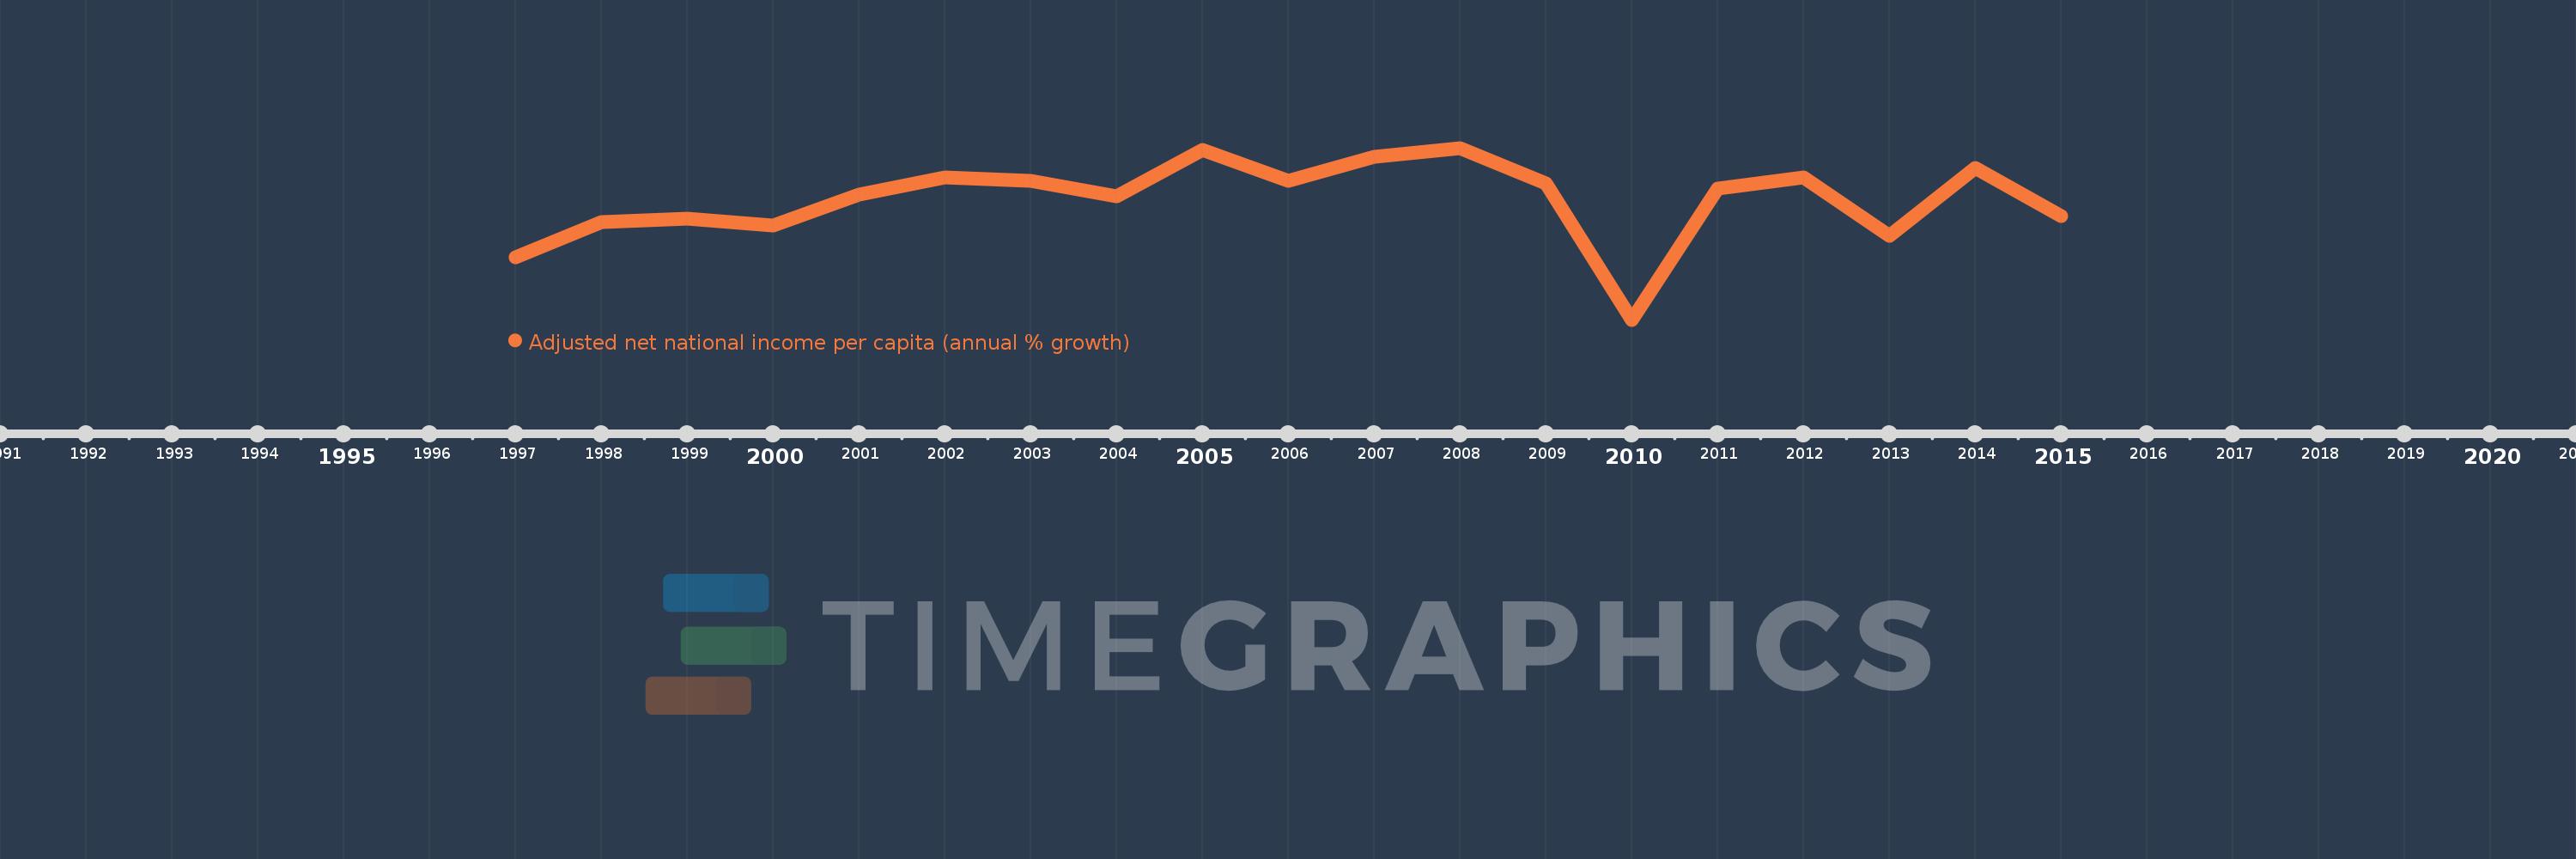
This timeline shows a graph from 1997 to 2015 of Ukraine. No data until 1996. Number of actual observations by date: 19.
Source name:
World Development Indicators
Source organization:
World Bank staff estimates based on sources and methods in World Bank's "The Changing Wealth of Nations: Measuring Sustainable Development in the New Millennium" (2011).
Categories, topics:
Economy & Growth
Last updated:
apr 23, 2017
Indicators value changes by year
Meaning:
3.711
Minimum:
-22.215
jan 1, 2010
Maximum:
14.928
jan 1, 2008
At the date of observation
Value
Absolute change
Change from the previous value
jan 1, 1997
-8.803
-8.803
0.0%
jan 1, 1998
-1.127
+7.675
-87.19%
jan 1, 1999
-0.32
+0.808
-71.65%
jan 1, 2000
-1.802
-1.483
463.91%
jan 1, 2001
4.822
+6.625
-367.54%
jan 1, 2002
8.611
+3.789
78.58%
jan 1, 2003
7.773
-0.838
-9.73%
jan 1, 2004
4.519
-3.254
-41.86%
jan 1, 2005
14.575
+10.055
222.51%
jan 1, 2006
7.826
-6.748
-46.3%
jan 1, 2007
12.99
+5.164
65.98%
jan 1, 2008
14.928
+1.938
14.92%
jan 1, 2009
7.257
-7.671
-51.38%
jan 1, 2010
-22.215
-29.473
-406.1%
jan 1, 2011
6.144
+28.359
-127.66%
jan 1, 2012
8.585
+2.441
39.73%
jan 1, 2013
-4.131
-12.717
-148.12%
jan 1, 2014
10.585
+14.717
-356.22%
jan 1, 2015
0.292
-10.293
-97.24%
Ranking of countries by current statistics by years