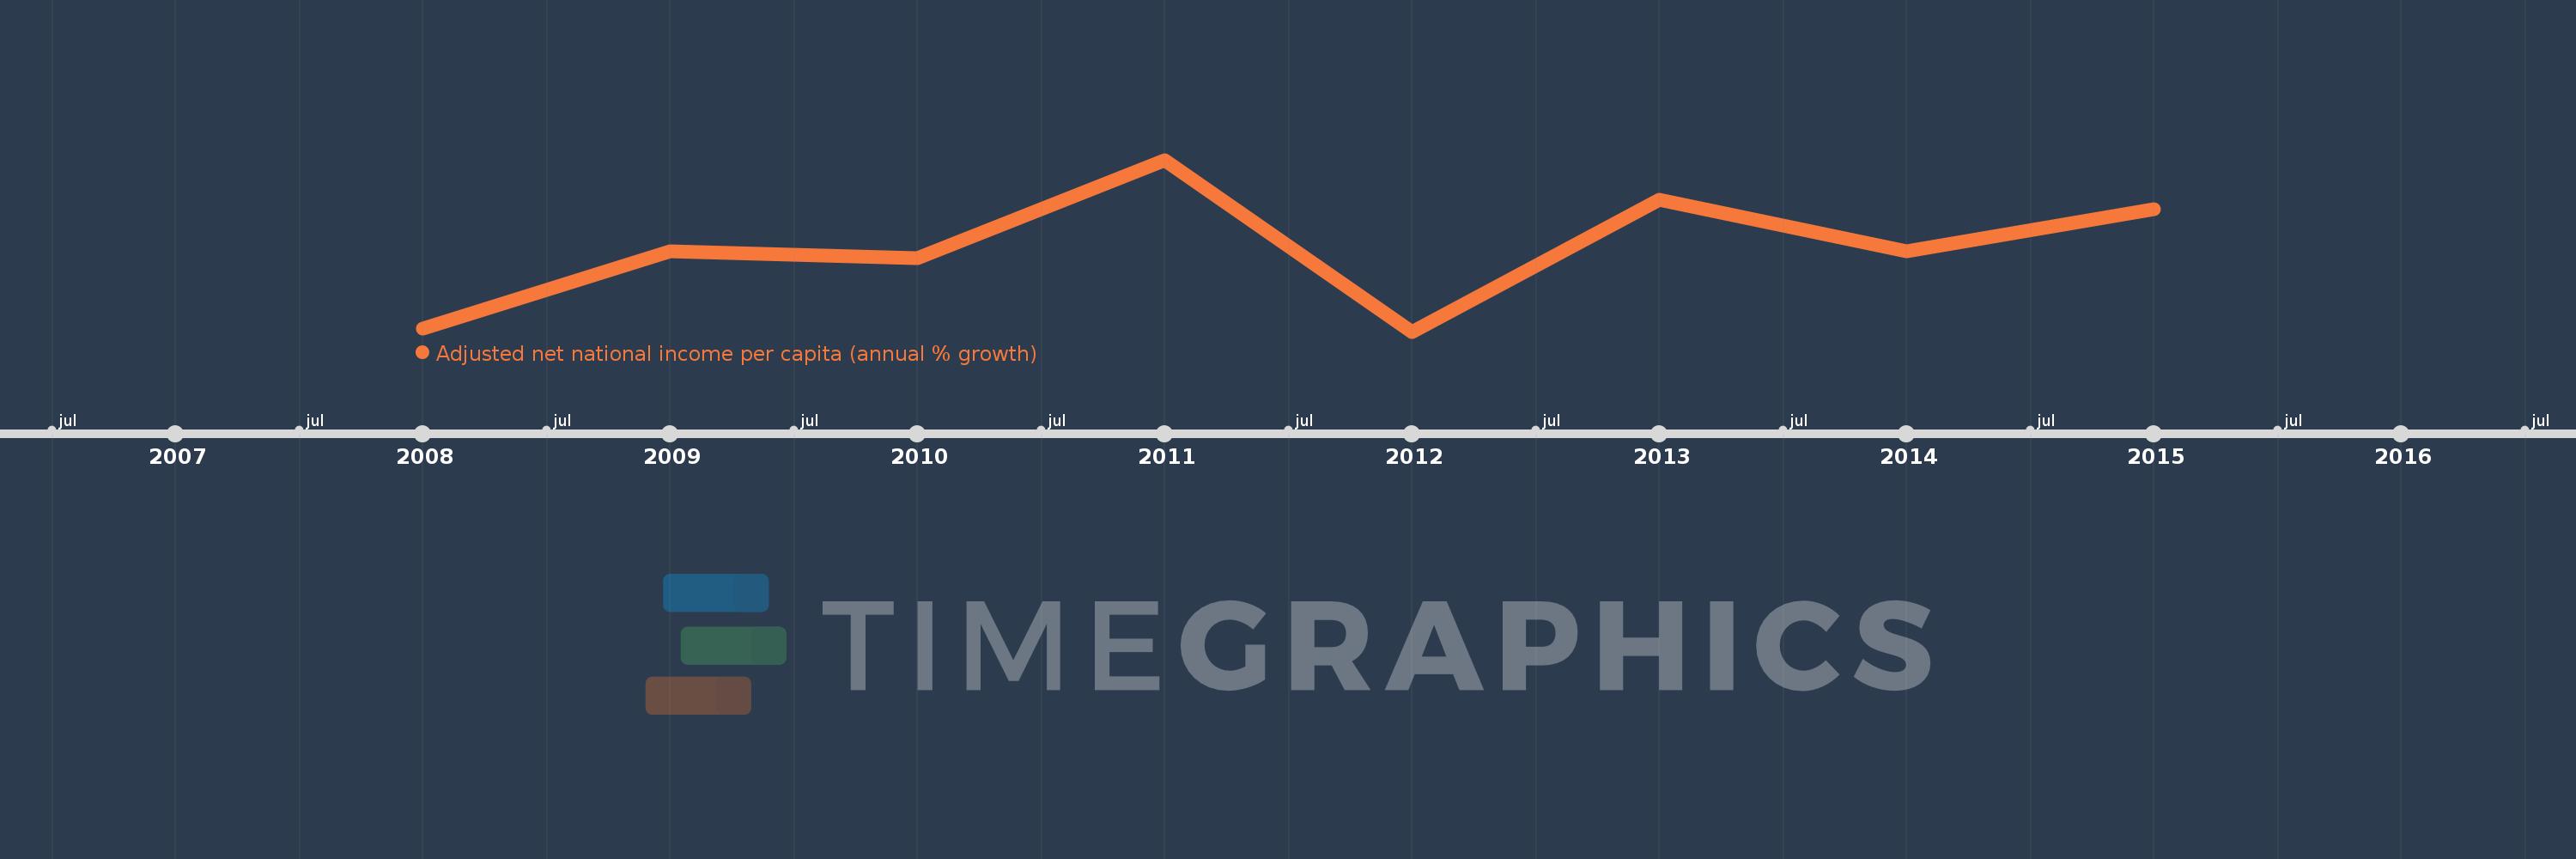
This timeline shows a graph from 2008 to 2015 of Niger. No data until 2007. Number of actual observations by date: 8.
Source name:
World Development Indicators
Source organization:
World Bank staff estimates based on sources and methods in World Bank's "The Changing Wealth of Nations: Measuring Sustainable Development in the New Millennium" (2011).
Categories, topics:
Economy & Growth
Last updated:
apr 23, 2017
Indicators value changes by year
Meaning:
0.468
Minimum:
-3.622
jan 1, 2012
Maximum:
4.859
jan 1, 2011
At the date of observation
Value
Absolute change
Change from the previous value
jan 1, 2008
-3.491
-3.491
0.0%
jan 1, 2009
0.337
+3.828
-109.65%
jan 1, 2010
0.006
-0.331
-98.35%
jan 1, 2011
4.859
+4.853
87.39K%
jan 1, 2012
-3.622
-8.481
-174.55%
jan 1, 2013
2.875
+6.497
-179.37%
jan 1, 2014
0.36
-2.515
-87.49%
jan 1, 2015
2.421
+2.061
573.16%
Ranking of countries by current statistics by years