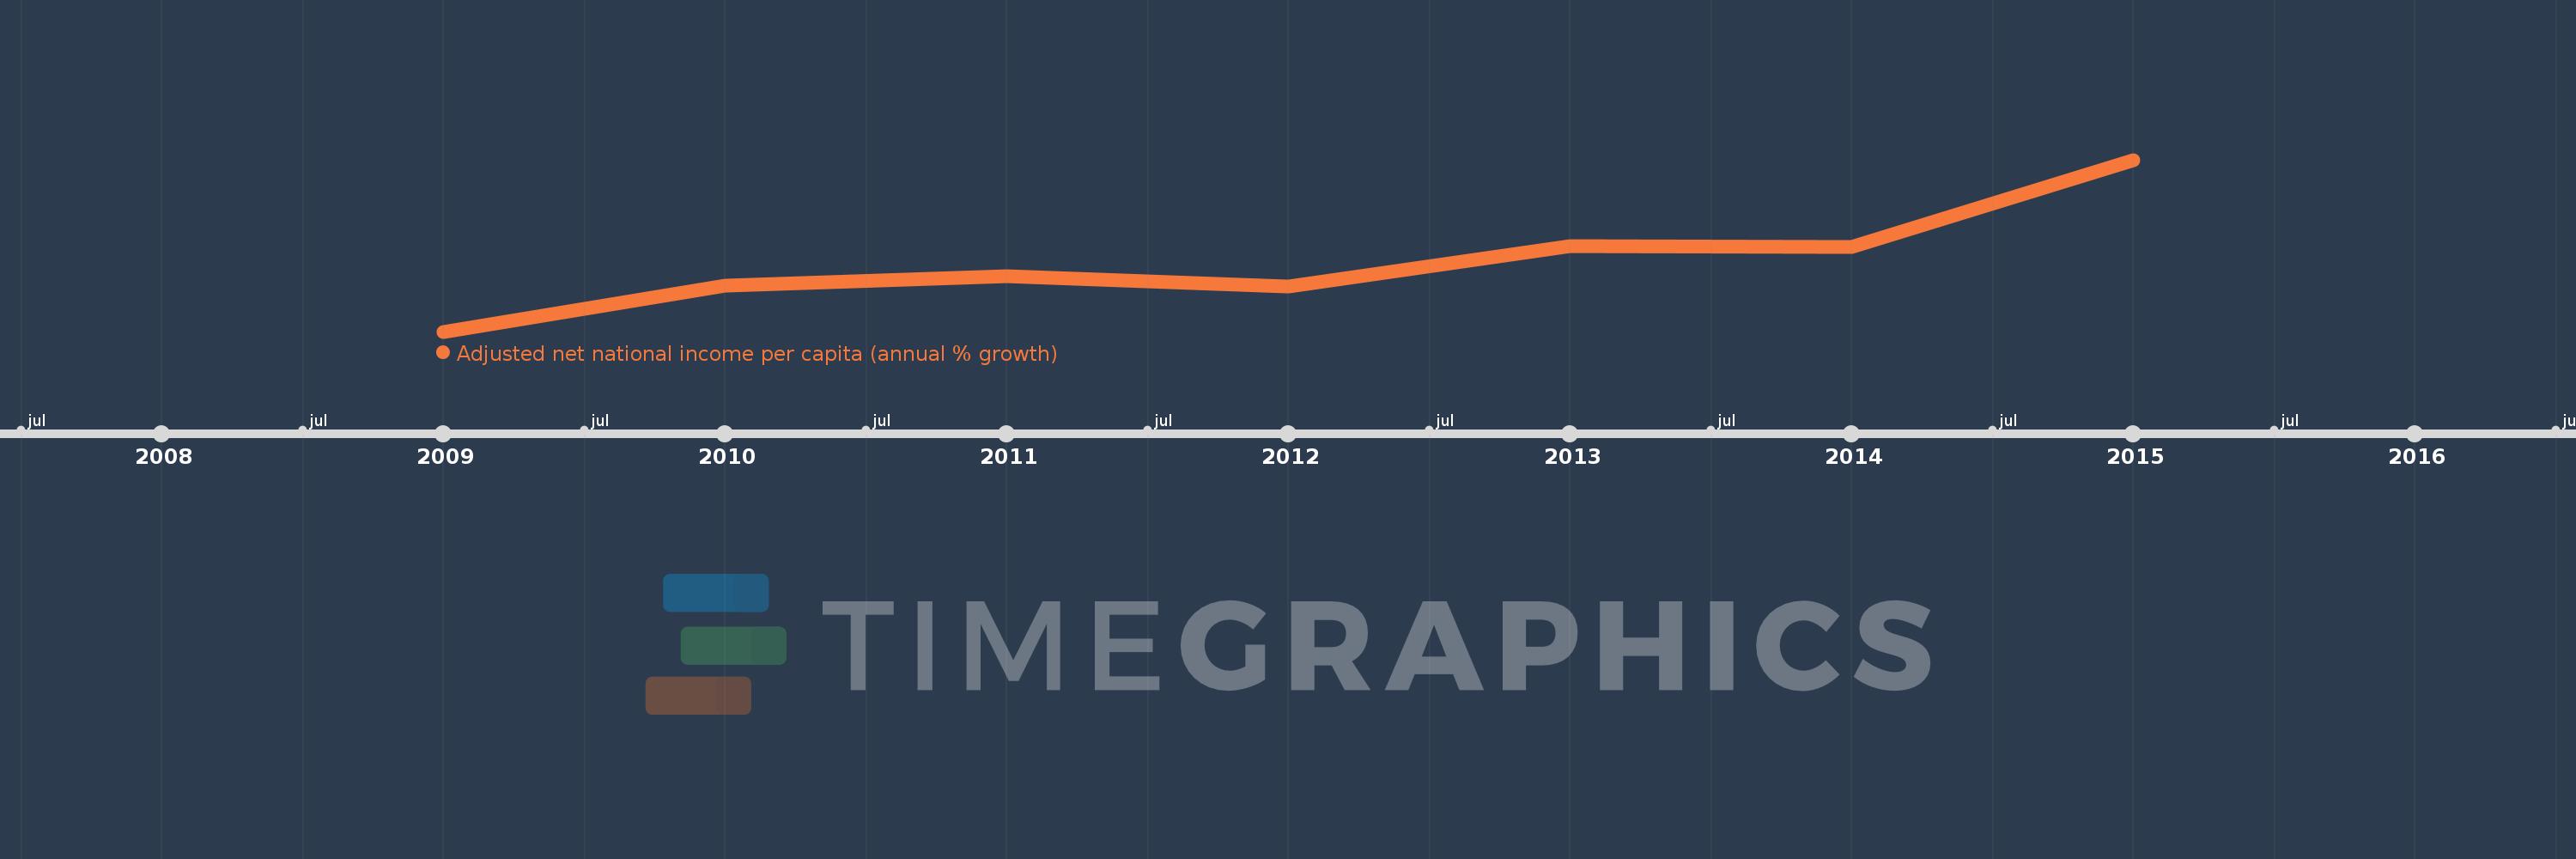
This timeline shows a graph from 2009 to 2015 of Caribbean small states. No data until 2008. Number of actual observations by date: 7.
Source name:
World Development Indicators
Source organization:
World Bank staff estimates based on sources and methods in World Bank's "The Changing Wealth of Nations: Measuring Sustainable Development in the New Millennium" (2011).
Categories, topics:
Economy & Growth
Last updated:
apr 23, 2017
Indicators value changes by year
Meaning:
3.32
Minimum:
-6.939
jan 1, 2009
Maximum:
18.332
jan 1, 2015
At the date of observation
Value
Absolute change
Change from the previous value
jan 1, 2009
-6.939
-6.939
0.0%
jan 1, 2010
-0.221
+6.718
-96.81%
jan 1, 2011
1.272
+1.493
-674.83%
jan 1, 2012
-0.31
-1.582
-124.36%
jan 1, 2013
5.639
+5.949
-1.92K%
jan 1, 2014
5.469
-0.17
-3.01%
jan 1, 2015
18.332
+12.863
235.19%
Ranking of countries by current statistics by years