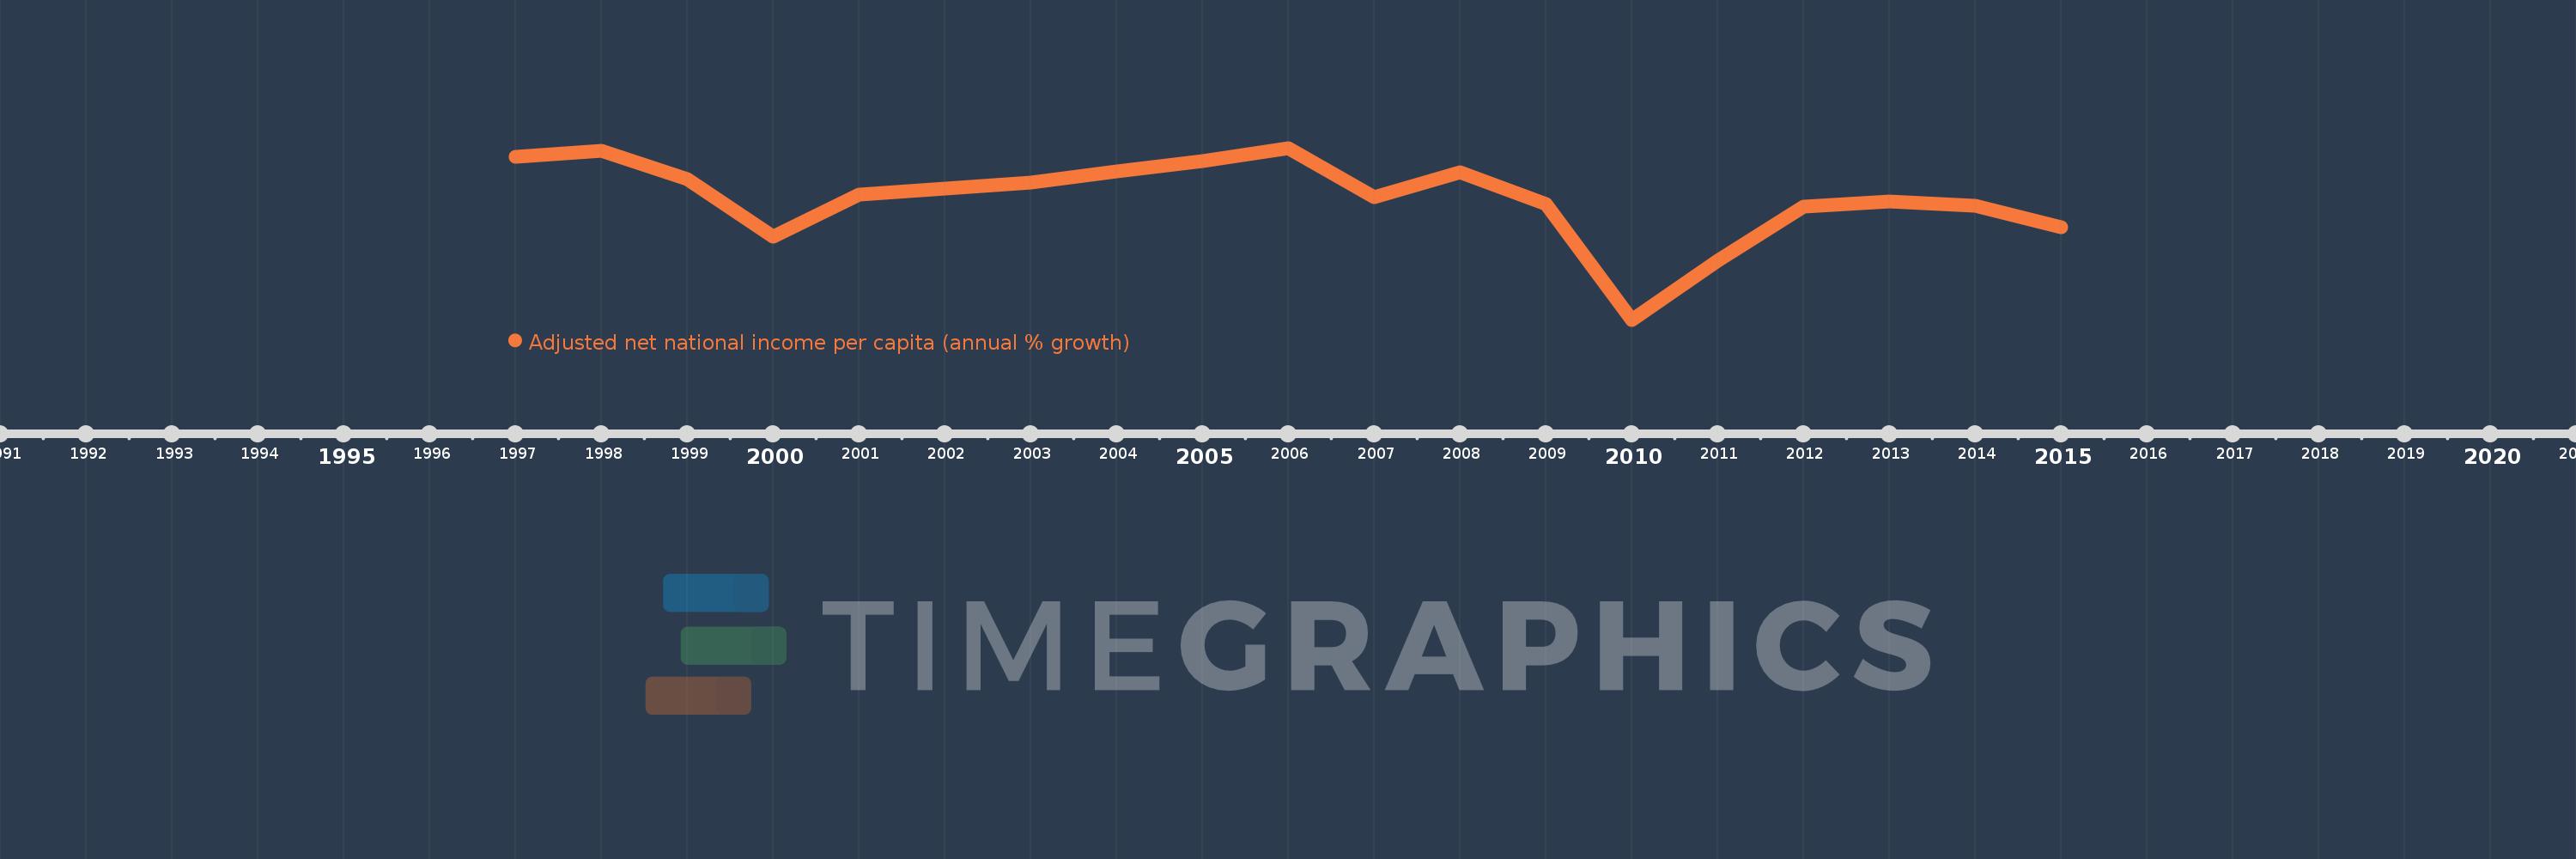
This timeline shows a graph from 1997 to 2015 of Lithuania. No data until 1996. Number of actual observations by date: 19.
Source name:
World Development Indicators
Source organization:
World Bank staff estimates based on sources and methods in World Bank's "The Changing Wealth of Nations: Measuring Sustainable Development in the New Millennium" (2011).
Categories, topics:
Economy & Growth
Last updated:
apr 23, 2017
Indicators value changes by year
Meaning:
6.745
Minimum:
-10.639
jan 1, 2010
Maximum:
13.904
jan 1, 2006
At the date of observation
Value
Absolute change
Change from the previous value
jan 1, 1997
12.653
+12.653
0.0%
jan 1, 1998
13.558
+0.906
7.16%
jan 1, 1999
9.428
-4.13
-30.46%
jan 1, 2000
1.262
-8.167
-86.62%
jan 1, 2001
7.249
+5.987
474.45%
jan 1, 2002
8.154
+0.905
12.49%
jan 1, 2003
9.015
+0.861
10.56%
jan 1, 2004
10.575
+1.559
17.3%
jan 1, 2005
12.041
+1.467
13.87%
jan 1, 2006
13.904
+1.862
15.47%
jan 1, 2007
6.833
-7.071
-50.86%
jan 1, 2008
10.467
+3.634
53.19%
jan 1, 2009
5.875
-4.592
-43.87%
jan 1, 2010
-10.639
-16.513
-281.09%
jan 1, 2011
-2.162
+8.477
-79.68%
jan 1, 2012
5.511
+7.672
-354.93%
jan 1, 2013
6.221
+0.71
12.88%
jan 1, 2014
5.641
-0.58
-9.32%
jan 1, 2015
2.575
-3.066
-54.35%
Ranking of countries by current statistics by years