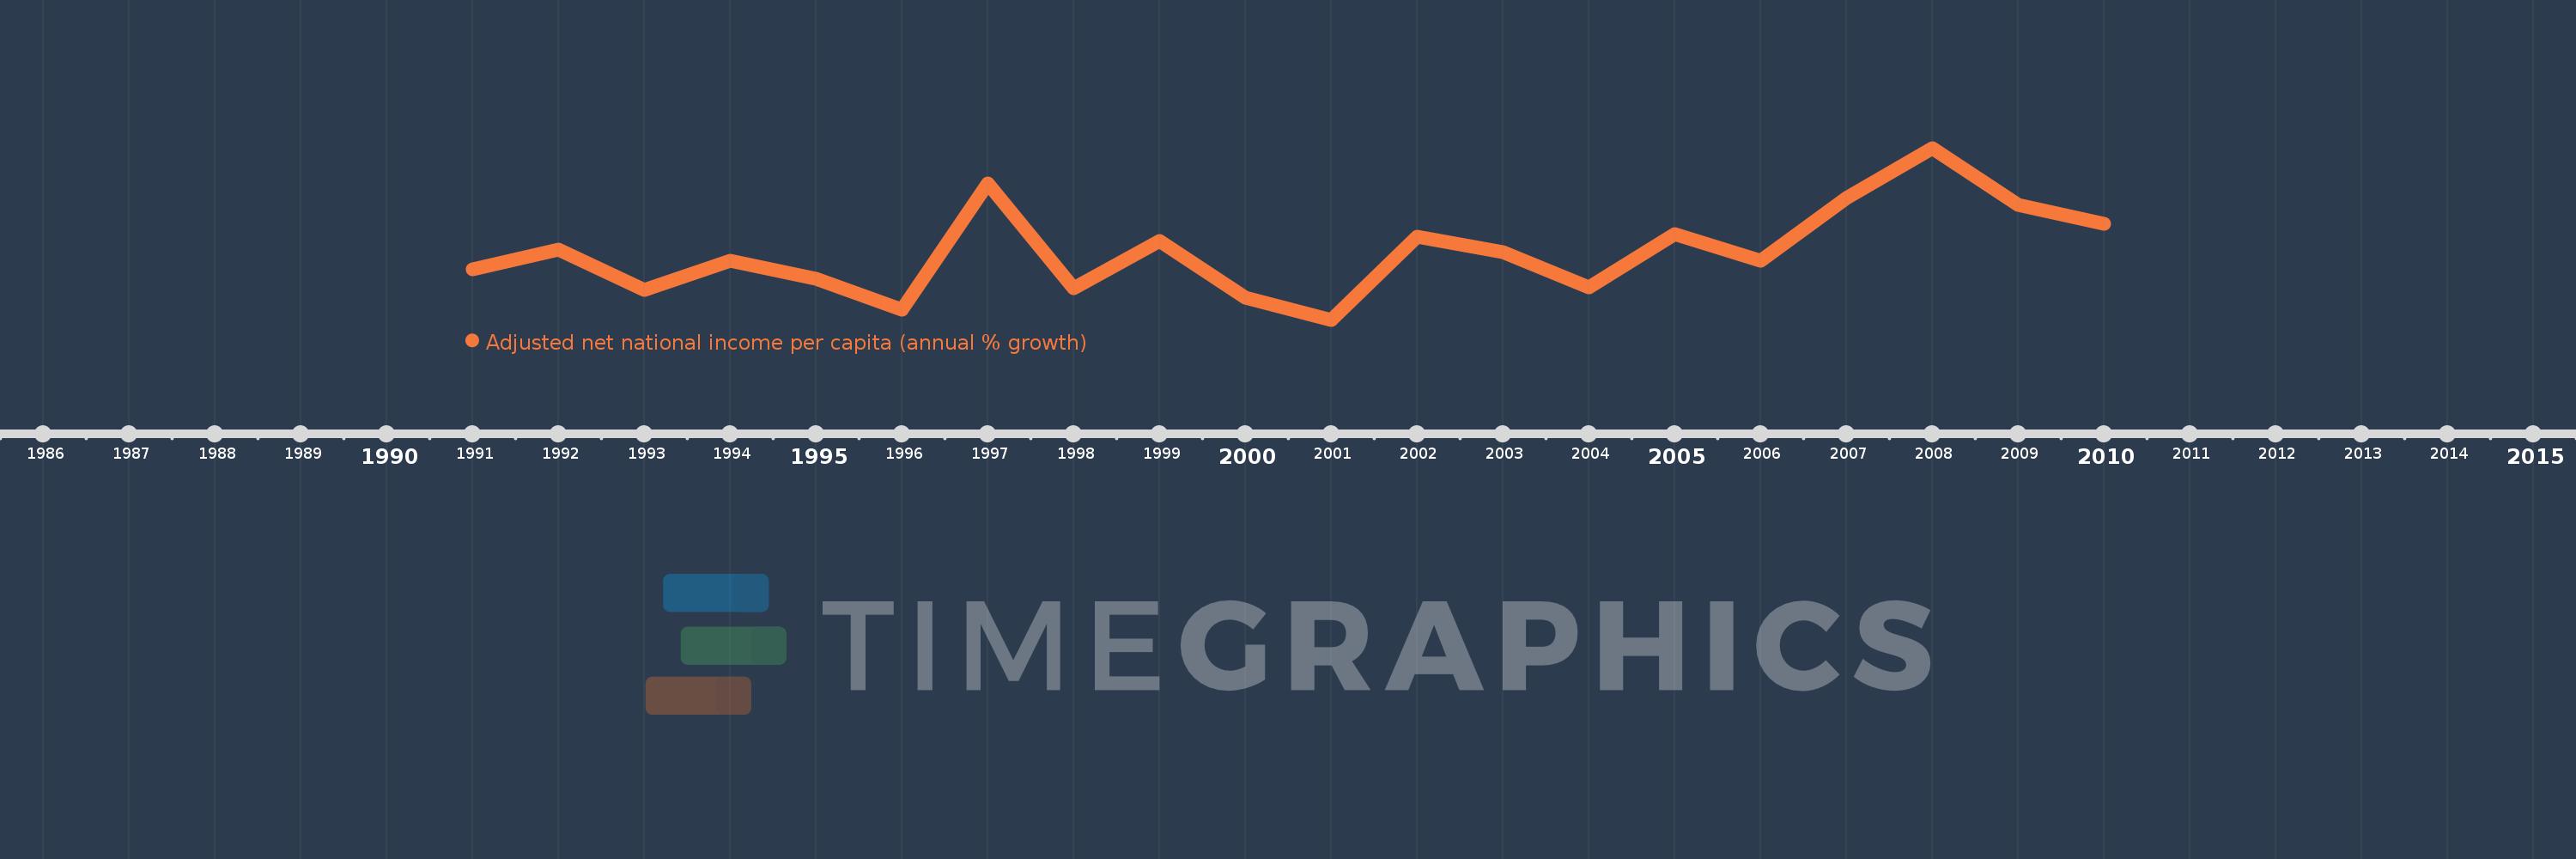
This timeline shows a graph from 1991 to 2010 of Brunei Darussalam. No data until 1990. Number of actual observations by date: 20.
Source name:
World Development Indicators
Source organization:
World Bank staff estimates based on sources and methods in World Bank's "The Changing Wealth of Nations: Measuring Sustainable Development in the New Millennium" (2011).
Categories, topics:
Economy & Growth
Last updated:
apr 23, 2017
Indicators value changes by year
Meaning:
2.563
Minimum:
-17.417
jan 1, 2001
Maximum:
32.969
jan 1, 2008
At the date of observation
Value
Absolute change
Change from the previous value
jan 1, 1991
-2.571
-2.571
0.0%
jan 1, 1992
3.145
+5.715
-222.33%
jan 1, 1993
-8.692
-11.837
-376.41%
jan 1, 1994
-0.055
+8.637
-99.36%
jan 1, 1995
-5.305
-5.25
9.51K%
jan 1, 1996
-14.354
-9.049
170.57%
jan 1, 1997
22.446
+36.799
-256.37%
jan 1, 1998
-8.114
-30.559
-136.15%
jan 1, 1999
5.754
+13.867
-170.91%
jan 1, 2000
-10.952
-16.706
-290.35%
jan 1, 2001
-17.417
-6.464
59.02%
jan 1, 2002
6.975
+24.392
-140.05%
jan 1, 2003
2.408
-4.567
-65.48%
jan 1, 2004
-7.97
-10.377
-431.01%
jan 1, 2005
7.612
+15.581
-195.51%
jan 1, 2006
-0.113
-7.724
-101.48%
jan 1, 2007
18.357
+18.47
-16.36K%
jan 1, 2008
32.969
+14.612
79.6%
jan 1, 2009
16.315
-16.654
-50.51%
jan 1, 2010
10.818
-5.497
-33.69%
Ranking of countries by current statistics by years