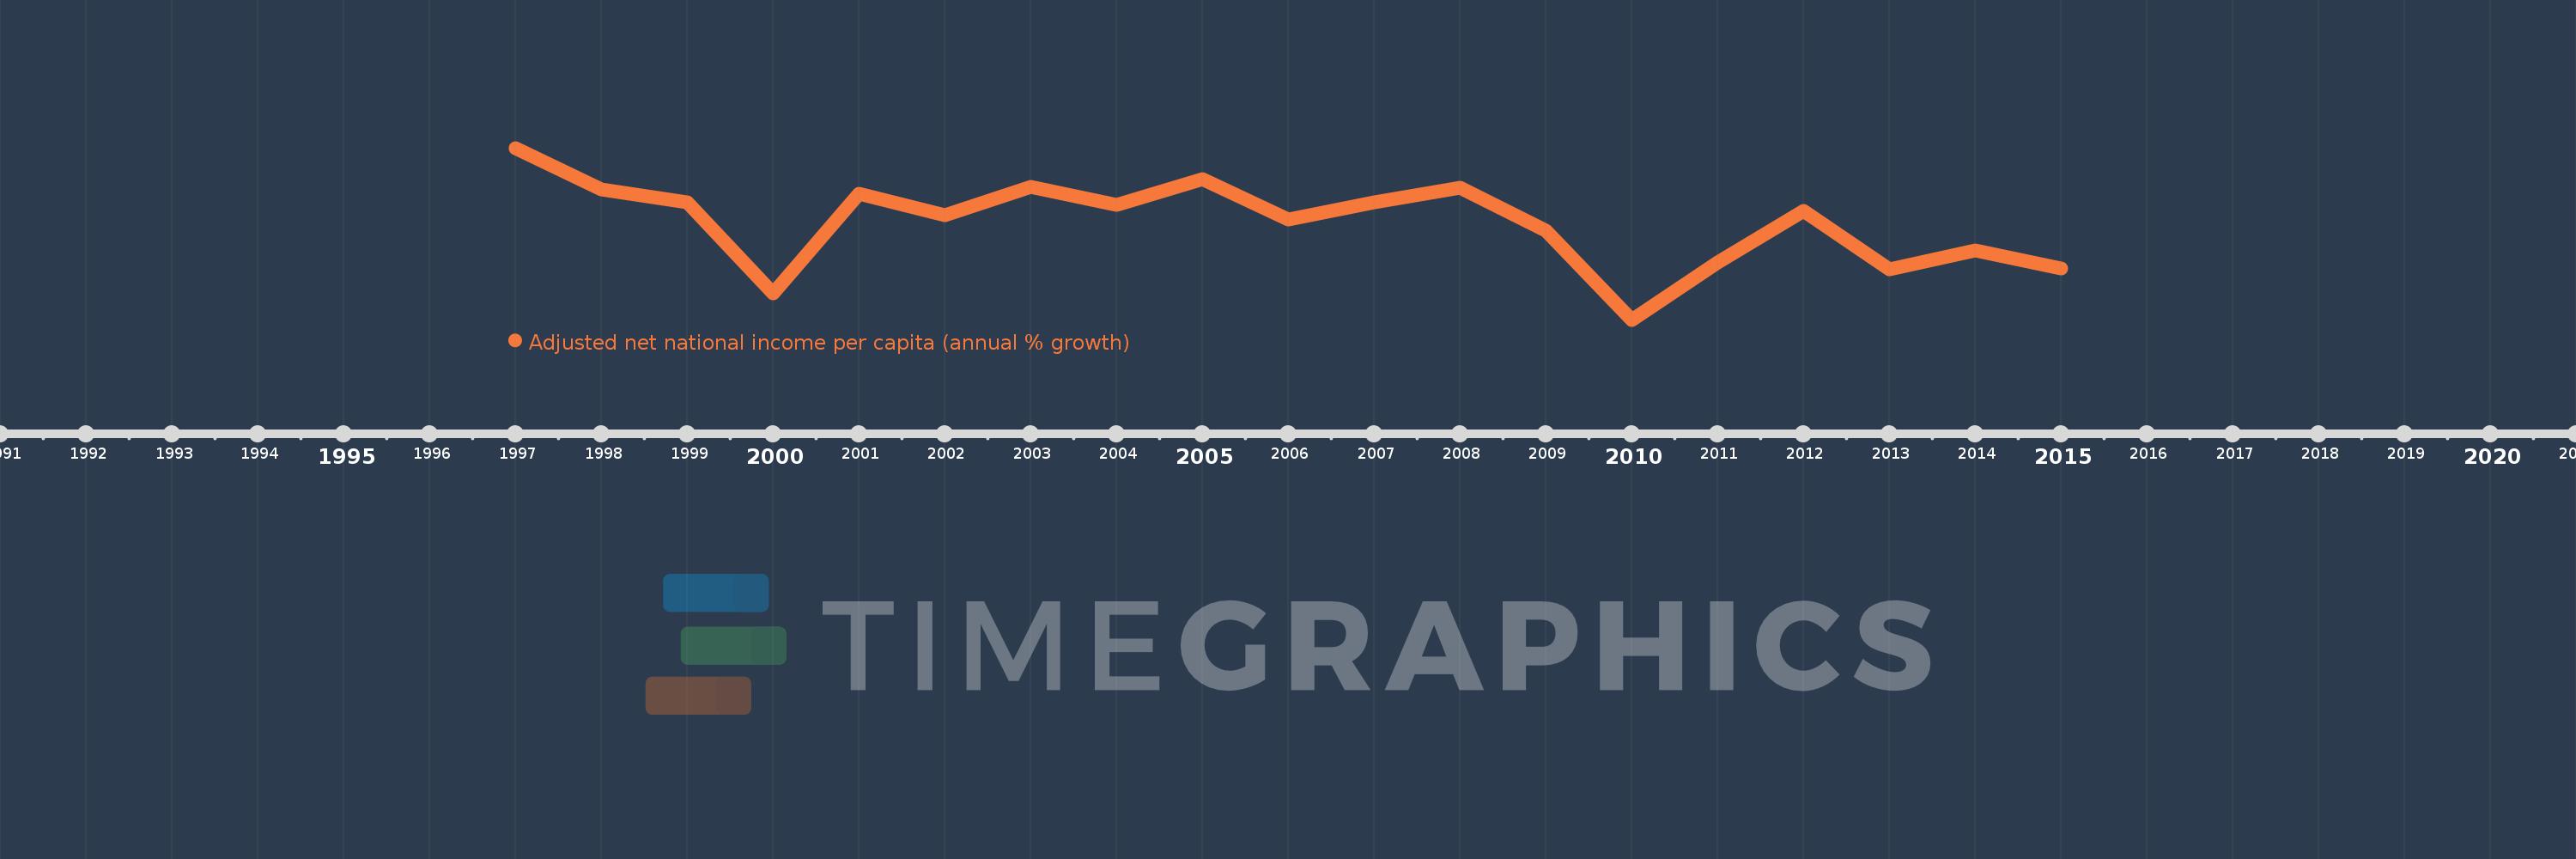
This timeline shows a graph from 1997 to 2015 of Croatia. No data until 1996. Number of actual observations by date: 19.
Source name:
World Development Indicators
Source organization:
World Bank staff estimates based on sources and methods in World Bank's "The Changing Wealth of Nations: Measuring Sustainable Development in the New Millennium" (2011).
Categories, topics:
Economy & Growth
Last updated:
apr 23, 2017
Indicators value changes by year
Meaning:
2.55
Minimum:
-8.04
jan 1, 2010
Maximum:
10.748
jan 1, 1997
At the date of observation
Value
Absolute change
Change from the previous value
jan 1, 1997
10.748
+10.748
0.0%
jan 1, 1998
6.194
-4.554
-42.37%
jan 1, 1999
4.808
-1.386
-22.37%
jan 1, 2000
-5.141
-9.949
-206.92%
jan 1, 2001
5.737
+10.878
-211.6%
jan 1, 2002
3.407
-2.33
-40.61%
jan 1, 2003
6.457
+3.05
89.53%
jan 1, 2004
4.543
-1.914
-29.64%
jan 1, 2005
7.31
+2.767
60.9%
jan 1, 2006
2.947
-4.363
-59.69%
jan 1, 2007
4.773
+1.827
61.99%
jan 1, 2008
6.378
+1.605
33.62%
jan 1, 2009
1.713
-4.665
-73.15%
jan 1, 2010
-8.04
-9.753
-569.42%
jan 1, 2011
-1.788
+6.251
-77.76%
jan 1, 2012
3.84
+5.629
-314.72%
jan 1, 2013
-2.555
-6.395
-166.54%
jan 1, 2014
-0.499
+2.056
-80.47%
jan 1, 2015
-2.389
-1.89
378.68%
Ranking of countries by current statistics by years