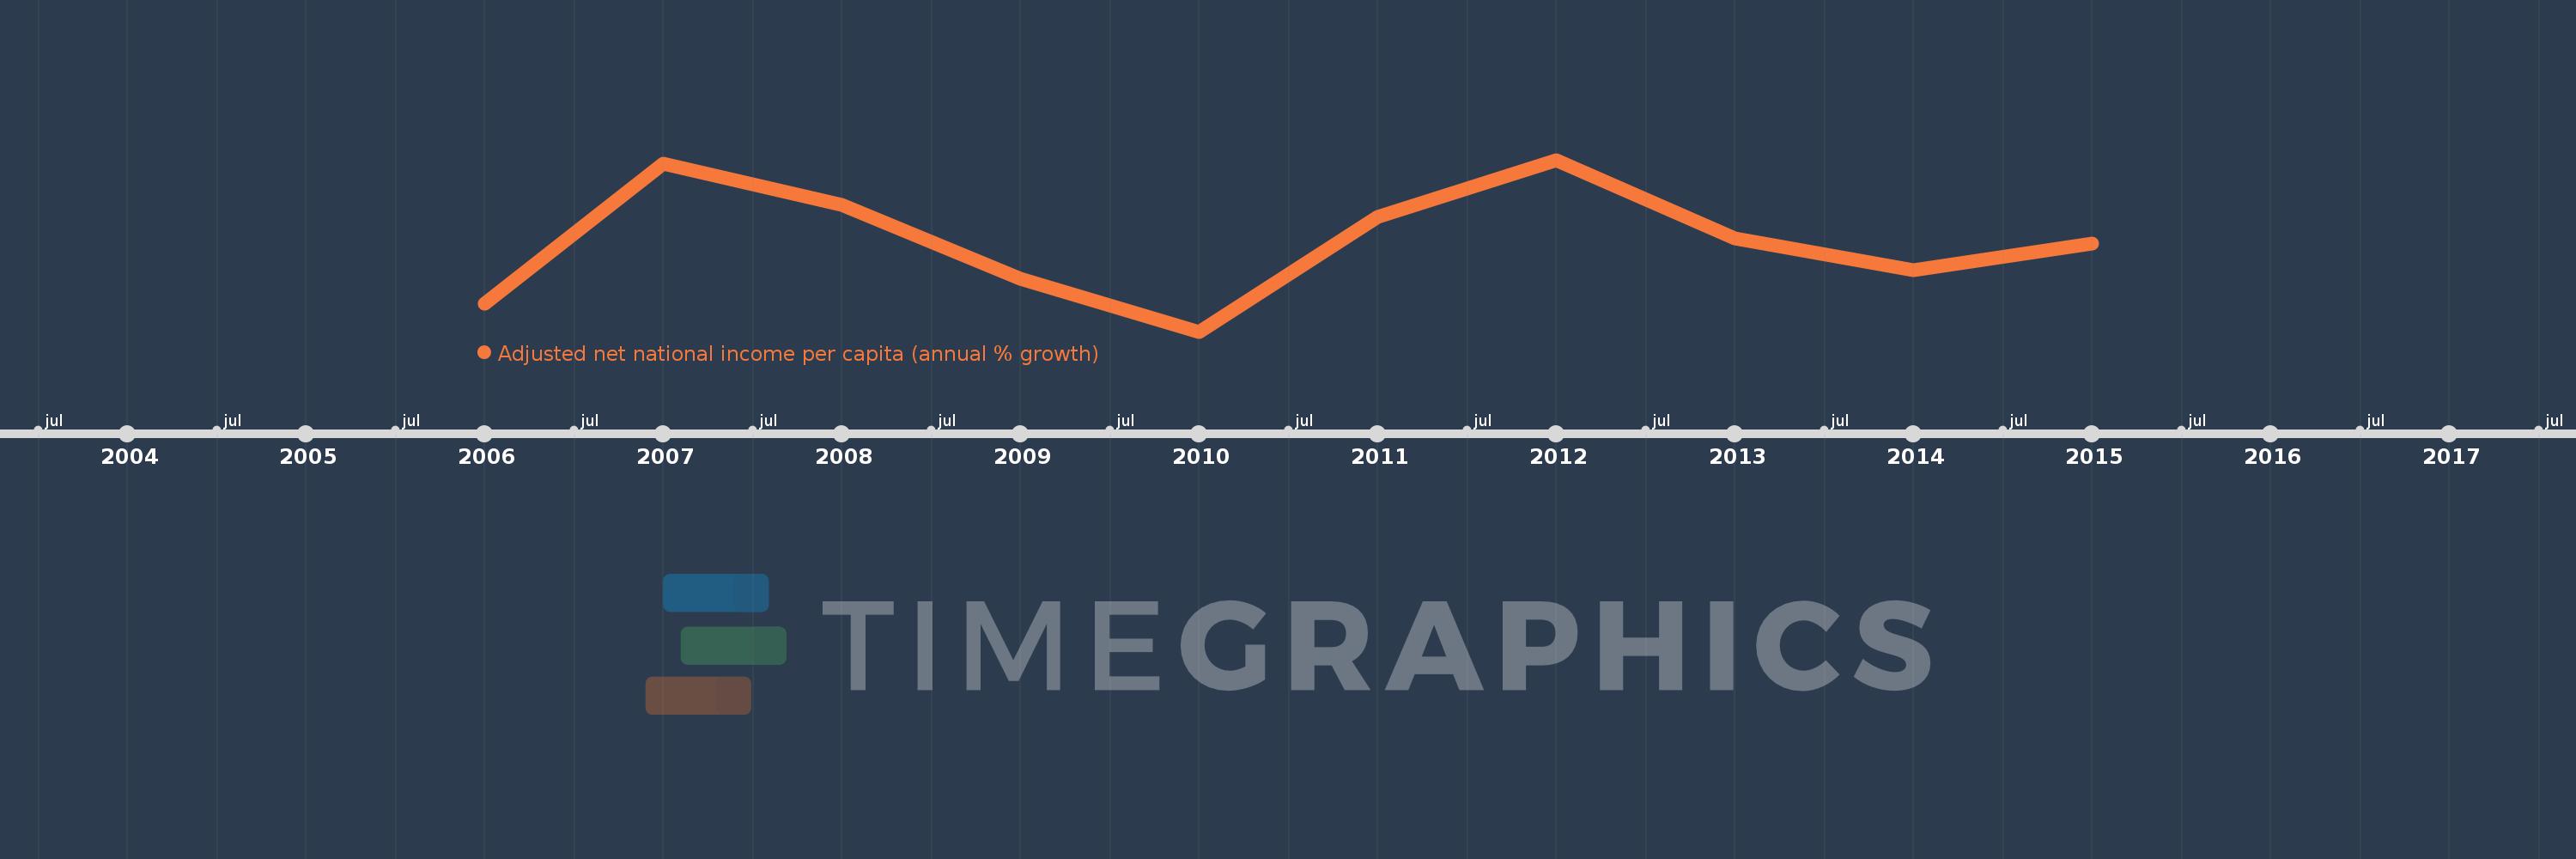
This timeline shows a graph from 2006 to 2015 of Small states. No data until 2005. Number of actual observations by date: 10.
Source name:
World Development Indicators
Source organization:
World Bank staff estimates based on sources and methods in World Bank's "The Changing Wealth of Nations: Measuring Sustainable Development in the New Millennium" (2011).
Categories, topics:
Economy & Growth
Last updated:
apr 23, 2017
Indicators value changes by year
Meaning:
5.747
Minimum:
-3.297
jan 1, 2010
Maximum:
13.871
jan 1, 2012
At the date of observation
Value
Absolute change
Change from the previous value
jan 1, 2006
-0.536
-0.536
0.0%
jan 1, 2007
13.486
+14.022
-2.61K%
jan 1, 2008
9.393
-4.093
-30.35%
jan 1, 2009
2.015
-7.378
-78.55%
jan 1, 2010
-3.297
-5.312
-263.6%
jan 1, 2011
8.184
+11.481
-348.24%
jan 1, 2012
13.871
+5.687
69.49%
jan 1, 2013
6.012
-7.859
-56.66%
jan 1, 2014
2.8
-3.212
-53.42%
jan 1, 2015
5.542
+2.742
97.91%
Ranking of countries by current statistics by years