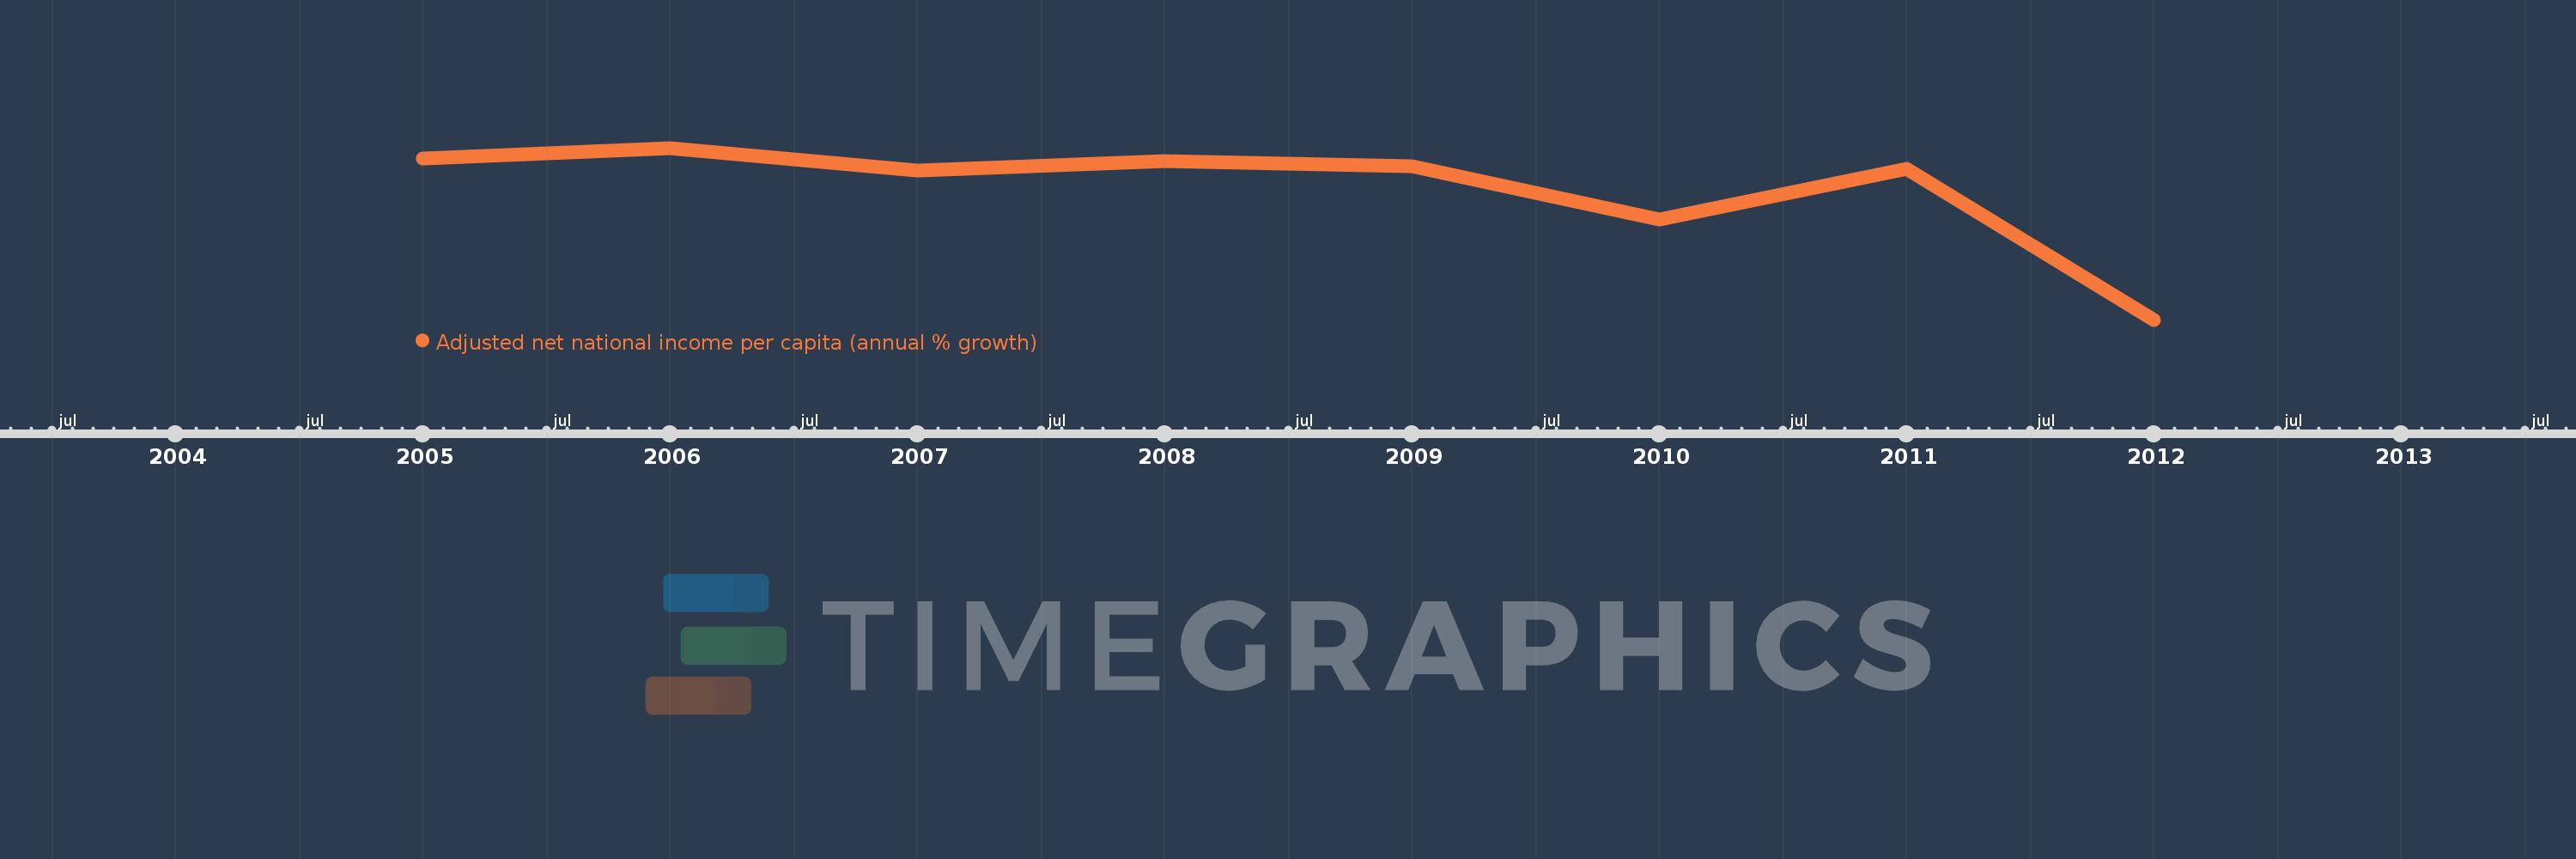
This timeline shows a graph from 2005 to 2012 of Libya. No data until 2004. Number of actual observations by date: 8.
Source name:
World Development Indicators
Source organization:
World Bank staff estimates based on sources and methods in World Bank's "The Changing Wealth of Nations: Measuring Sustainable Development in the New Millennium" (2011).
Categories, topics:
Economy & Growth
Last updated:
apr 23, 2017
Indicators value changes by year
Meaning:
-1.228
Minimum:
-59.75
jan 1, 2012
Maximum:
17.18
jan 1, 2006
At the date of observation
Value
Absolute change
Change from the previous value
jan 1, 2005
12.341
+12.341
0.0%
jan 1, 2006
17.18
+4.839
39.21%
jan 1, 2007
6.923
-10.257
-59.7%
jan 1, 2008
11.315
+4.393
63.45%
jan 1, 2009
9.033
-2.282
-20.17%
jan 1, 2010
-14.825
-23.859
-264.12%
jan 1, 2011
7.958
+22.783
-153.68%
jan 1, 2012
-59.75
-67.708
-850.82%
Ranking of countries by current statistics by years