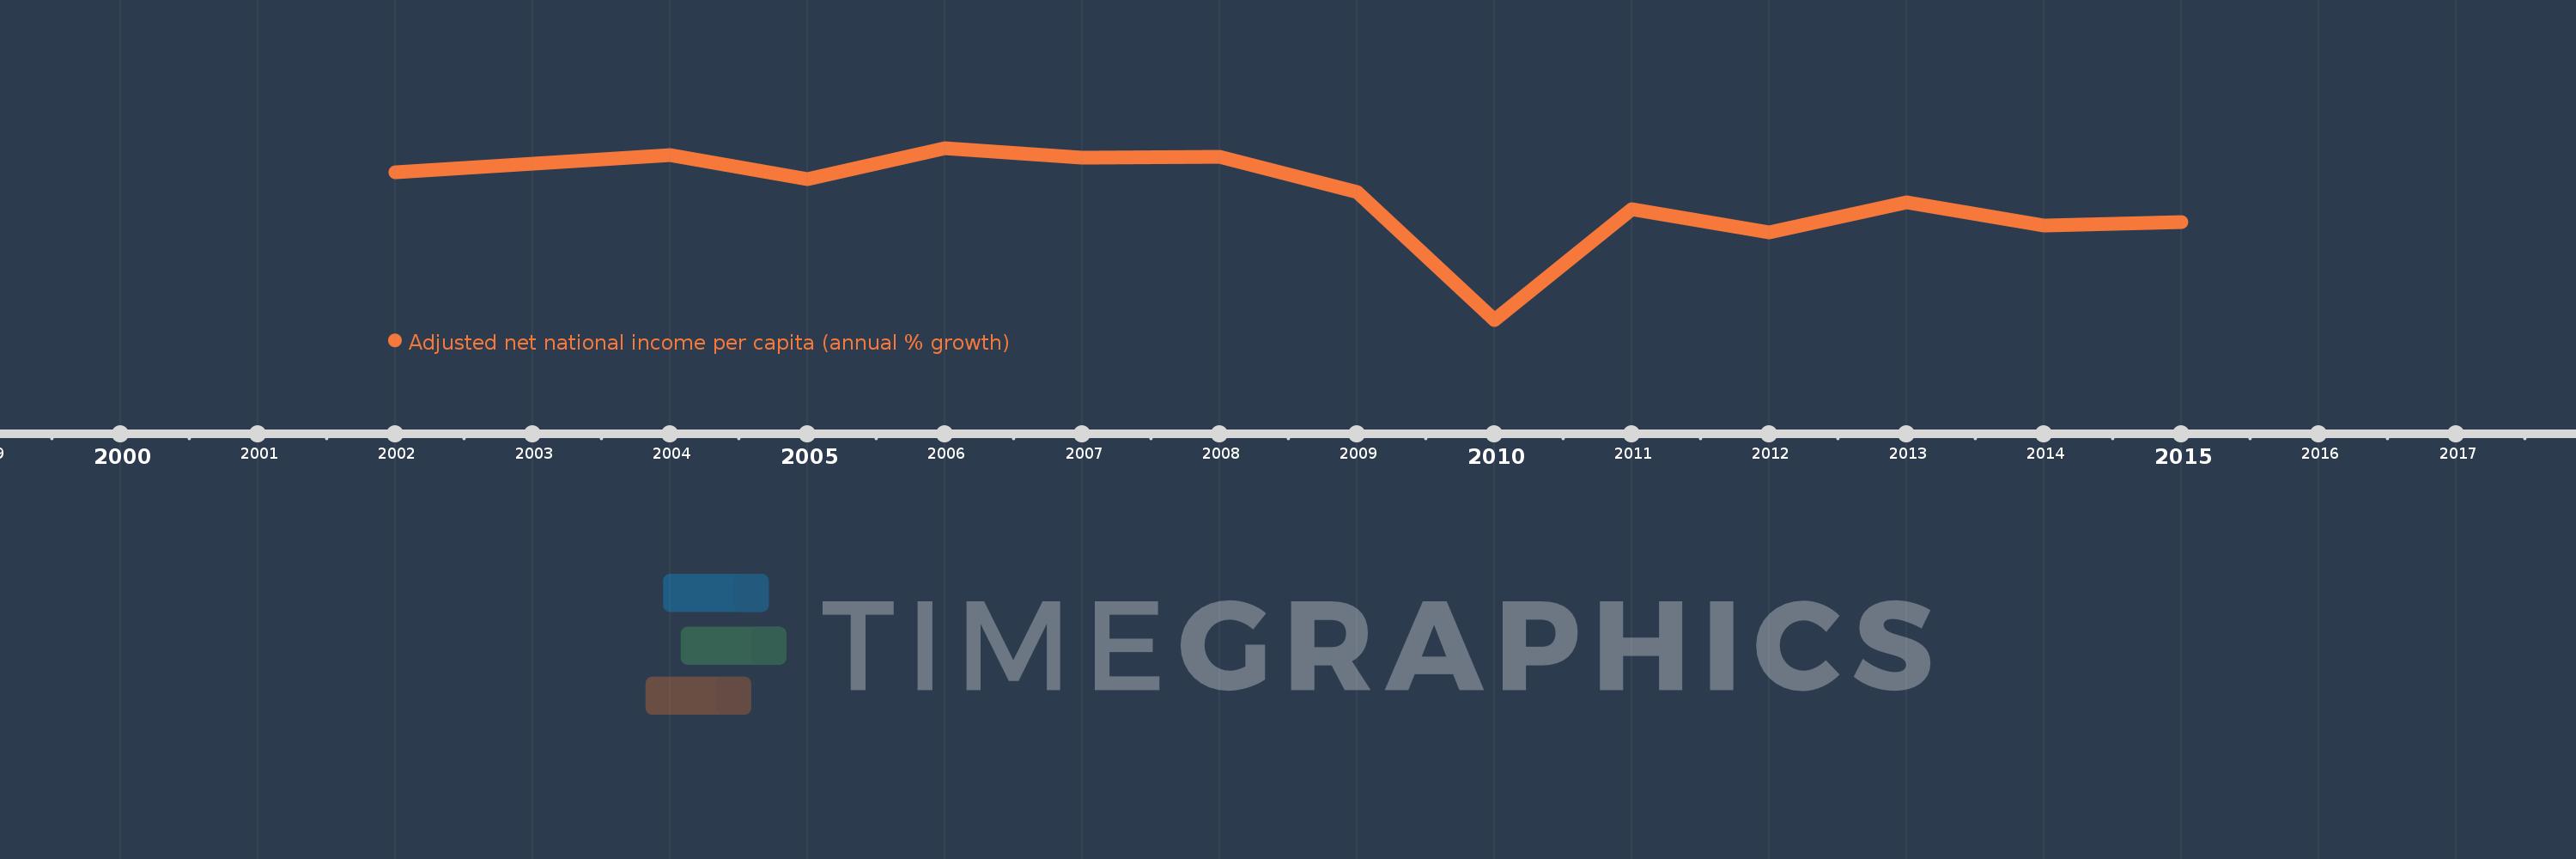
This timeline shows a graph from 2002 to 2015 of Armenia. No data until 2001. Number of actual observations by date: 14.
Source name:
World Development Indicators
Source organization:
World Bank staff estimates based on sources and methods in World Bank's "The Changing Wealth of Nations: Measuring Sustainable Development in the New Millennium" (2011).
Categories, topics:
Economy & Growth
Last updated:
apr 23, 2017
Indicators value changes by year
Meaning:
7.133
Minimum:
-19.684
jan 1, 2010
Maximum:
17.348
jan 1, 2006
At the date of observation
Value
Absolute change
Change from the previous value
jan 1, 2002
12.019
+12.019
0.0%
jan 1, 2003
14.052
+2.032
16.91%
jan 1, 2004
15.84
+1.788
12.72%
jan 1, 2005
10.58
-5.259
-33.2%
jan 1, 2006
17.348
+6.767
63.96%
jan 1, 2007
15.295
-2.053
-11.83%
jan 1, 2008
15.457
+0.162
1.06%
jan 1, 2009
7.931
-7.526
-48.69%
jan 1, 2010
-19.684
-27.615
-348.19%
jan 1, 2011
4.216
+23.9
-121.42%
jan 1, 2012
-0.765
-4.981
-118.14%
jan 1, 2013
5.662
+6.426
-840.48%
jan 1, 2014
0.561
-5.1
-90.09%
jan 1, 2015
1.356
+0.795
141.59%
Ranking of countries by current statistics by years