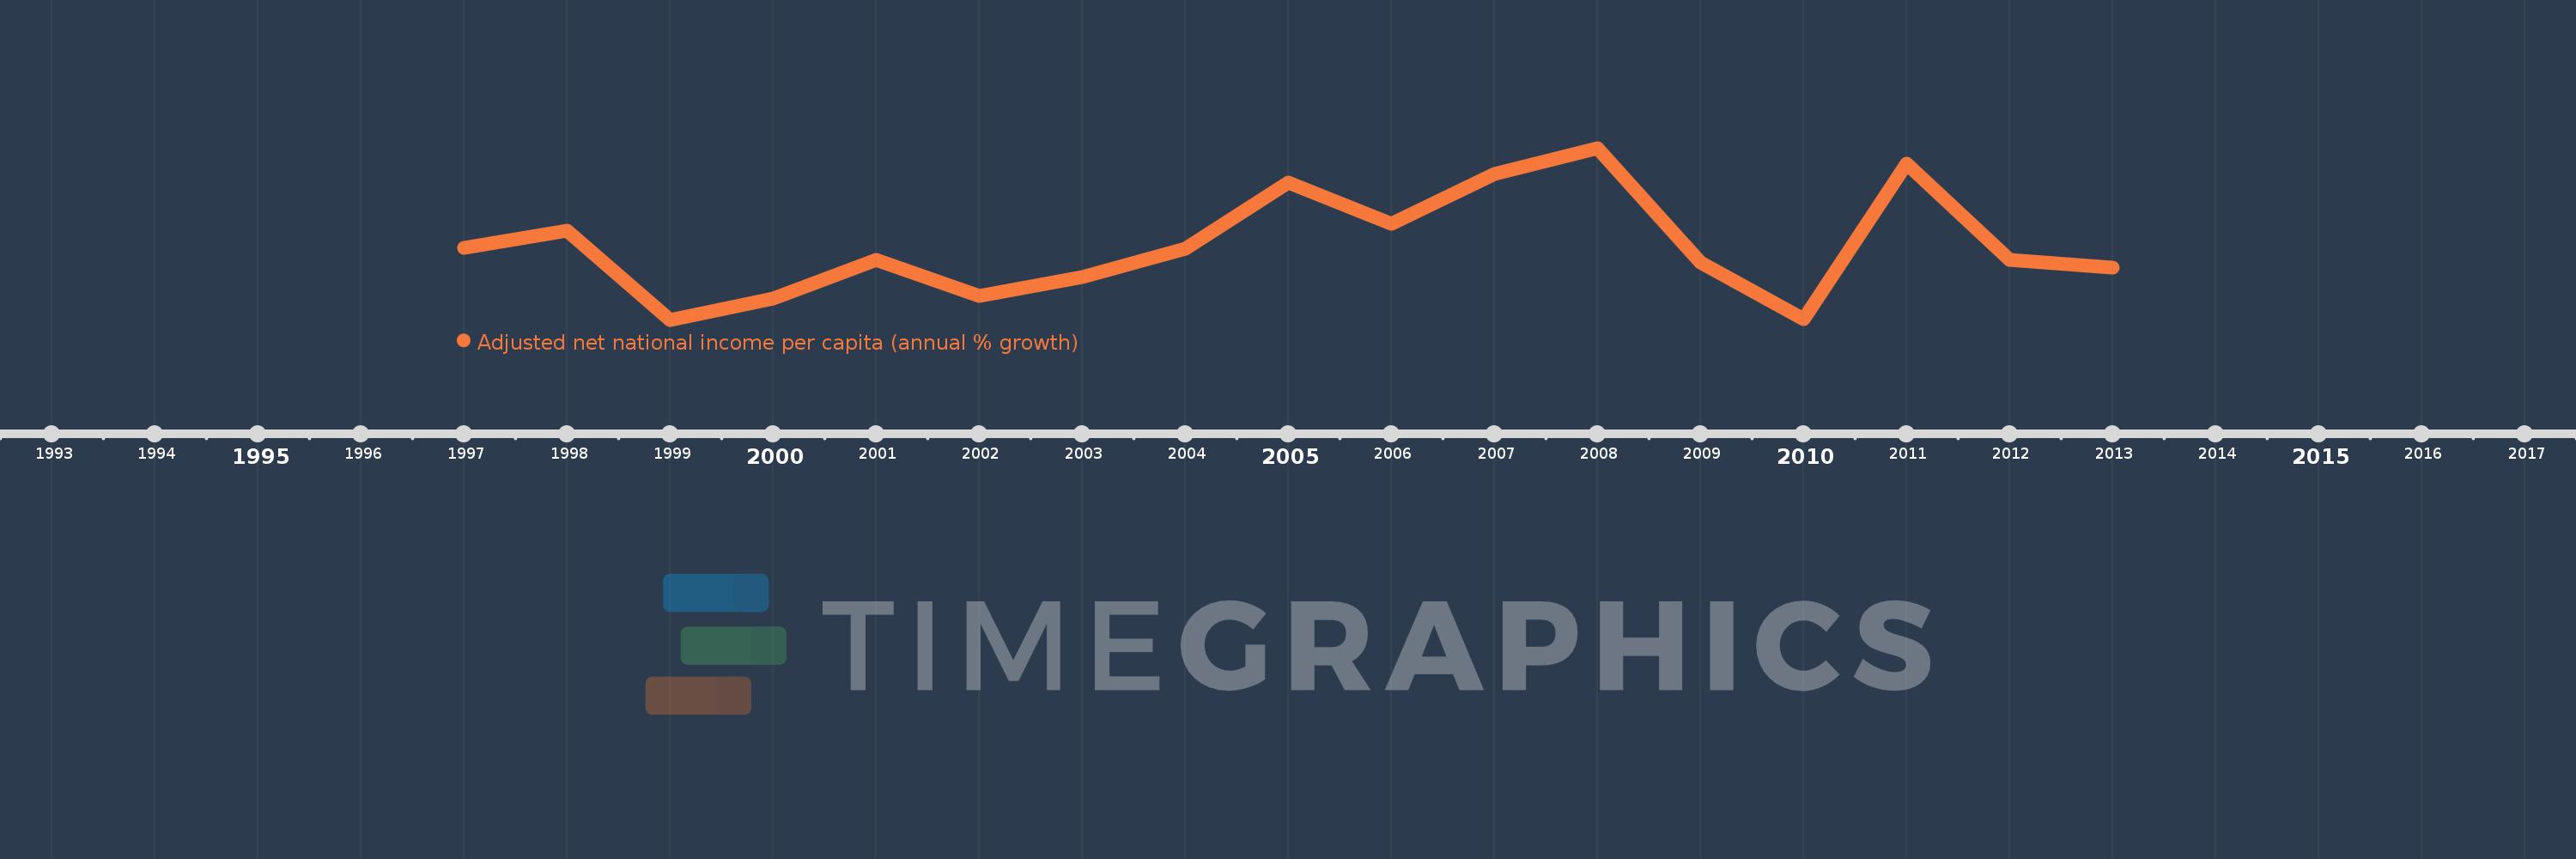
This timeline shows a graph from 1997 to 2013 of IBRD only. No data until 1996. Number of actual observations by date: 17.
Source name:
World Development Indicators
Source organization:
World Bank staff estimates based on sources and methods in World Bank's "The Changing Wealth of Nations: Measuring Sustainable Development in the New Millennium" (2011).
Categories, topics:
Economy & Growth
Last updated:
apr 23, 2017
Indicators value changes by year
Meaning:
3.144
Minimum:
-0.507
jan 1, 1999
Maximum:
7.982
jan 1, 2008
At the date of observation
Value
Absolute change
Change from the previous value
jan 1, 1997
3.043
+3.043
0.0%
jan 1, 1998
3.902
+0.859
28.21%
jan 1, 1999
-0.507
-4.409
-113.0%
jan 1, 2000
0.555
+1.062
-209.44%
jan 1, 2001
2.44
+1.885
339.64%
jan 1, 2002
0.648
-1.791
-73.42%
jan 1, 2003
1.613
+0.965
148.78%
jan 1, 2004
3.011
+1.398
86.66%
jan 1, 2005
6.257
+3.246
107.82%
jan 1, 2006
4.246
-2.011
-32.14%
jan 1, 2007
6.689
+2.444
57.55%
jan 1, 2008
7.982
+1.293
19.32%
jan 1, 2009
2.335
-5.647
-70.74%
jan 1, 2010
-0.458
-2.793
-119.63%
jan 1, 2011
7.197
+7.655
-1.67K%
jan 1, 2012
2.442
-4.755
-66.08%
jan 1, 2013
2.055
-0.386
-15.82%
Ranking of countries by current statistics by years