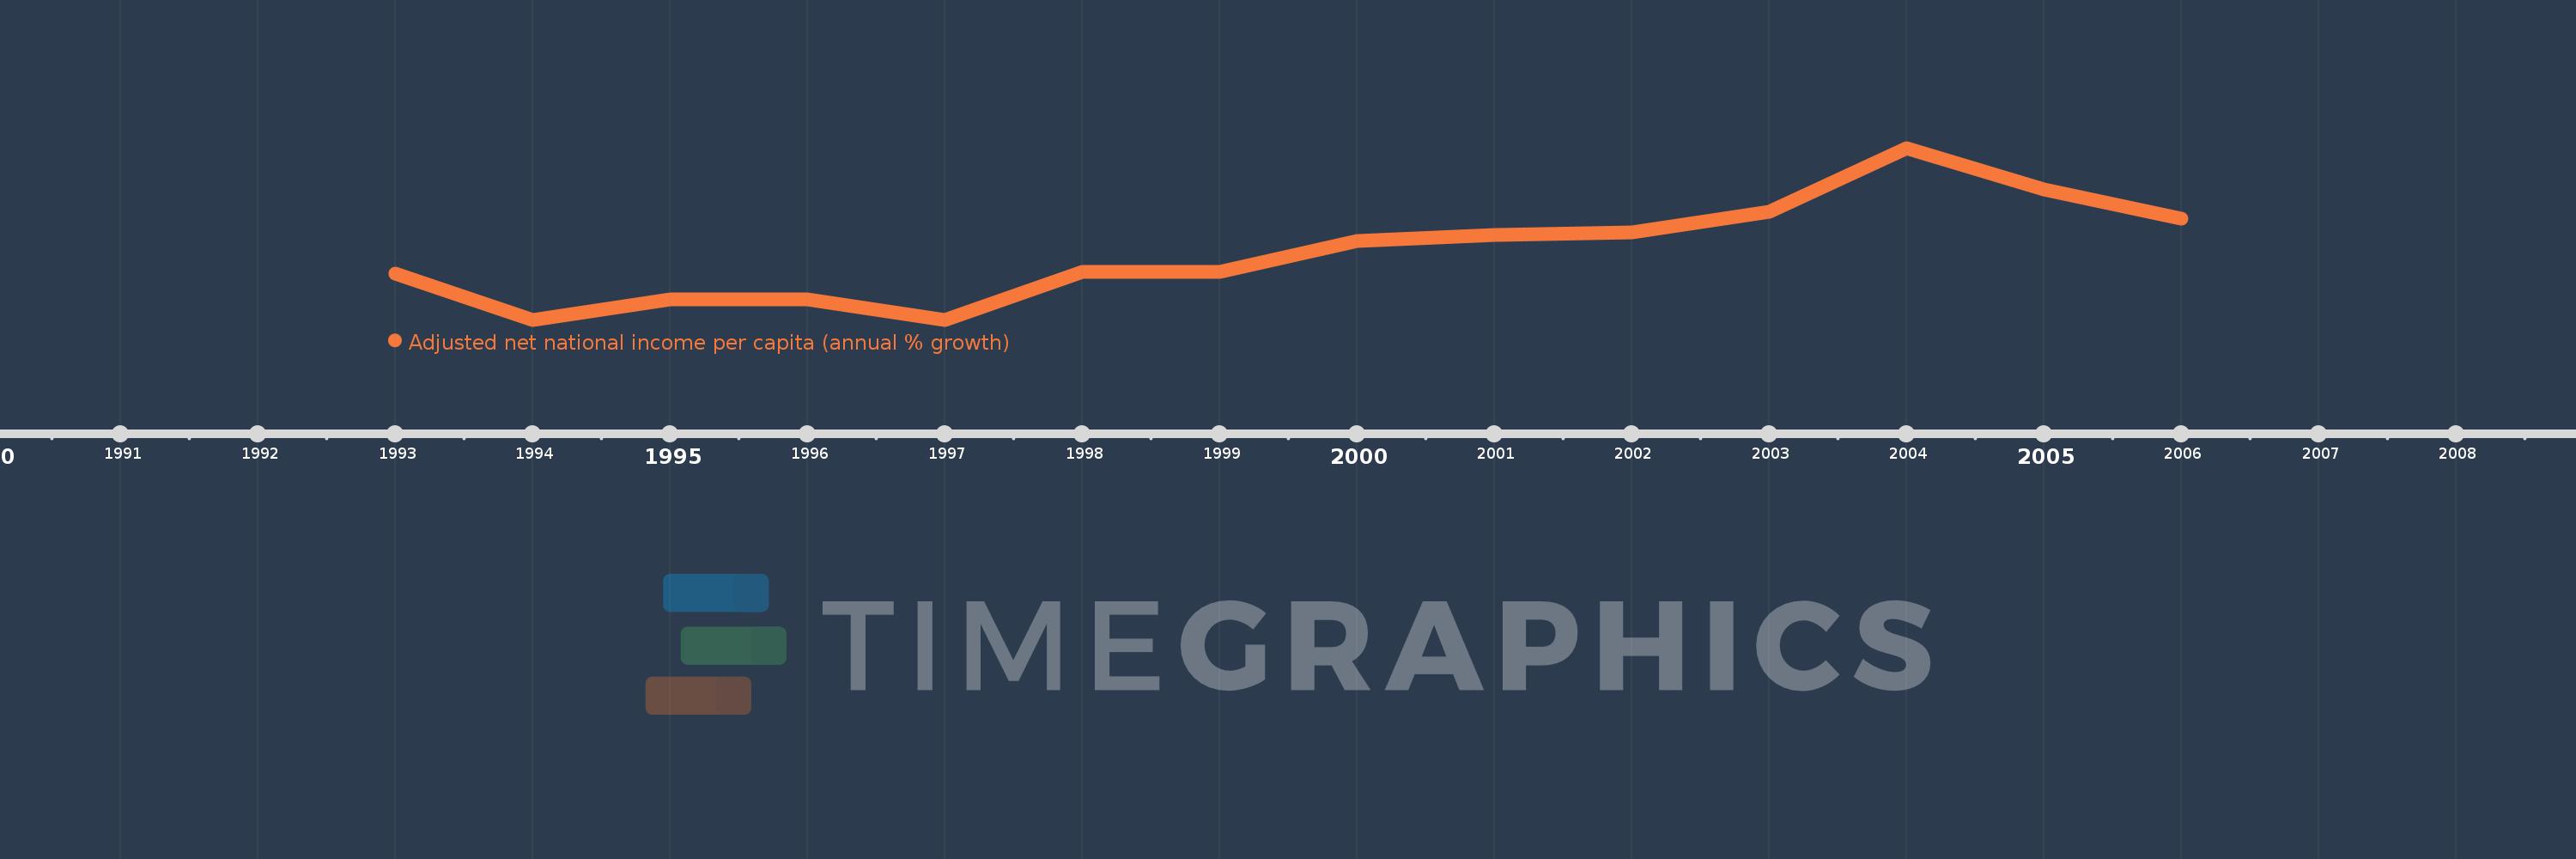
This timeline shows a graph from 1993 to 2006 of Djibouti. No data until 1992. Number of actual observations by date: 14.
Source name:
World Development Indicators
Source organization:
World Bank staff estimates based on sources and methods in World Bank's "The Changing Wealth of Nations: Measuring Sustainable Development in the New Millennium" (2011).
Categories, topics:
Economy & Growth
Last updated:
apr 23, 2017
Indicators value changes by year
Meaning:
-1.392
Minimum:
-7.532
jan 1, 1994
Maximum:
8.105
jan 1, 2004
At the date of observation
Value
Absolute change
Change from the previous value
jan 1, 1993
-3.336
-3.336
0.0%
jan 1, 1994
-7.532
-4.196
125.8%
jan 1, 1995
-5.716
+1.816
-24.11%
jan 1, 1996
-5.64
+0.076
-1.32%
jan 1, 1997
-7.526
-1.886
33.44%
jan 1, 1998
-3.181
+4.345
-57.74%
jan 1, 1999
-3.177
+0.004
-0.11%
jan 1, 2000
-0.394
+2.783
-87.59%
jan 1, 2001
0.202
+0.597
-151.29%
jan 1, 2002
0.425
+0.223
110.1%
jan 1, 2003
2.278
+1.853
435.98%
jan 1, 2004
8.105
+5.828
255.85%
jan 1, 2005
4.331
-3.774
-46.56%
jan 1, 2006
1.678
-2.653
-61.25%
Ranking of countries by current statistics by years