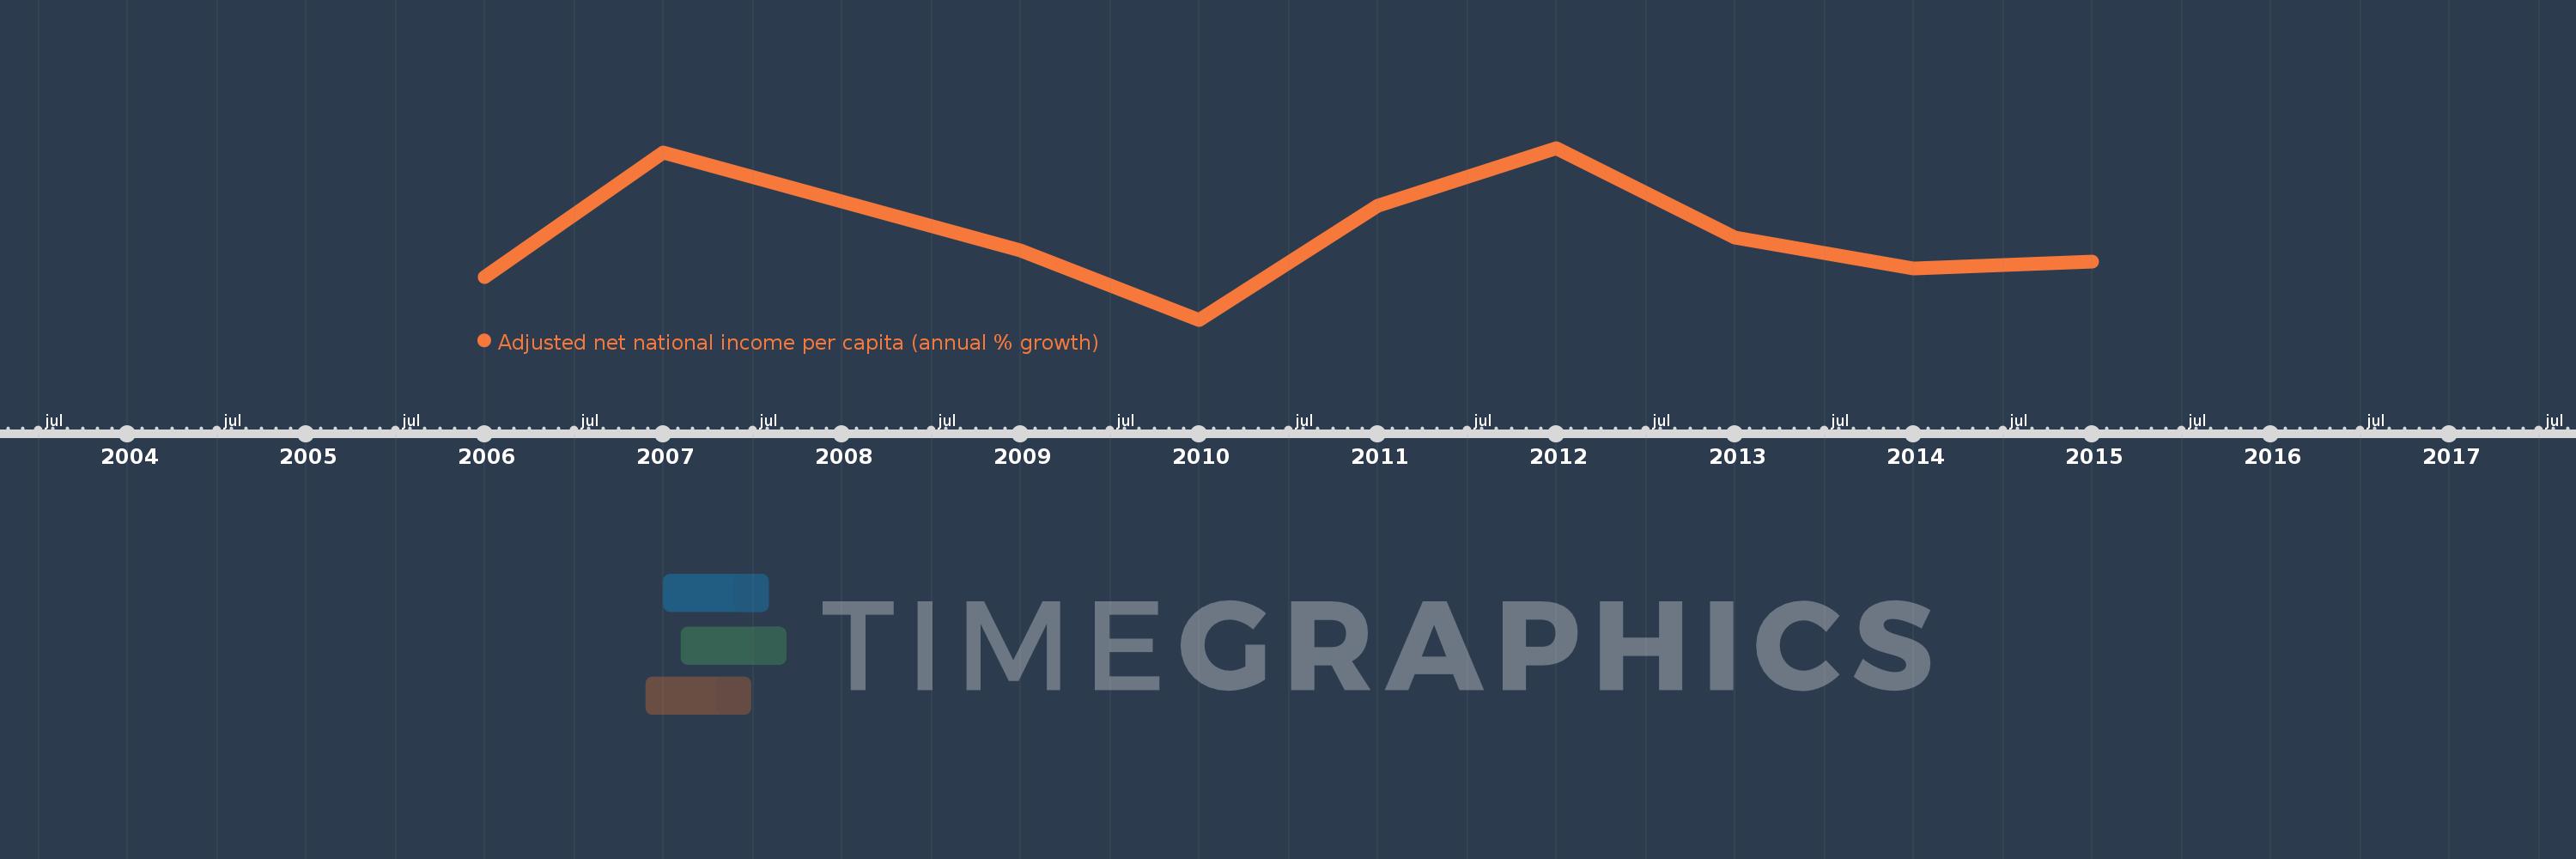
This timeline shows a graph from 2006 to 2015 of Other small states. No data until 2005. Number of actual observations by date: 10.
Source name:
World Development Indicators
Source organization:
World Bank staff estimates based on sources and methods in World Bank's "The Changing Wealth of Nations: Measuring Sustainable Development in the New Millennium" (2011).
Categories, topics:
Economy & Growth
Last updated:
apr 23, 2017
Indicators value changes by year
Meaning:
6.694
Minimum:
-4.159
jan 1, 2010
Maximum:
17.148
jan 1, 2012
At the date of observation
Value
Absolute change
Change from the previous value
jan 1, 2006
1.175
+1.175
0.0%
jan 1, 2007
16.542
+15.367
1.31K%
jan 1, 2008
10.551
-5.99
-36.21%
jan 1, 2009
4.487
-6.065
-57.48%
jan 1, 2010
-4.159
-8.646
-192.69%
jan 1, 2011
9.937
+14.096
-338.92%
jan 1, 2012
17.148
+7.211
72.57%
jan 1, 2013
5.986
-11.162
-65.09%
jan 1, 2014
2.209
-3.776
-63.09%
jan 1, 2015
3.062
+0.852
38.57%
Ranking of countries by current statistics by years