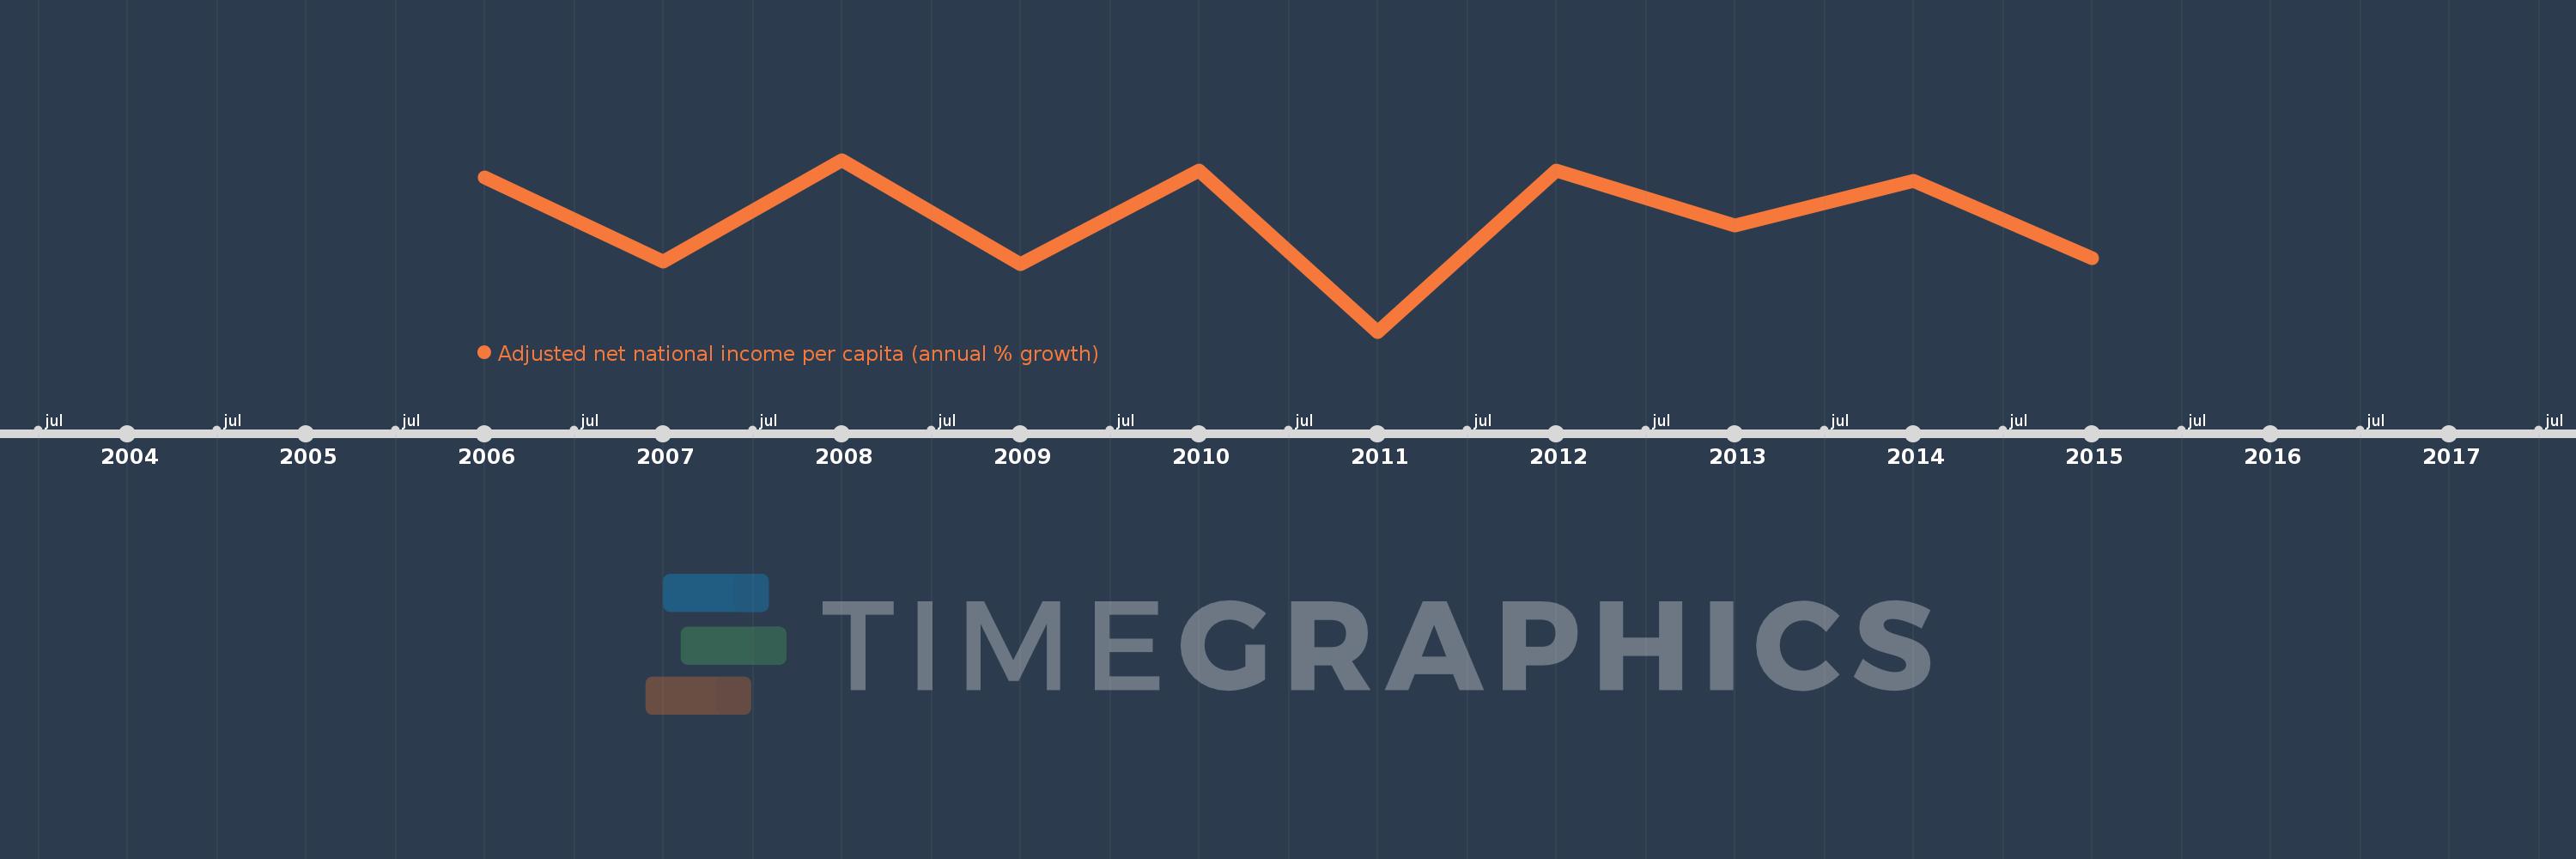
This timeline shows a graph from 2006 to 2015 of Haiti. No data until 2005. Number of actual observations by date: 10.
Source name:
World Development Indicators
Source organization:
World Bank staff estimates based on sources and methods in World Bank's "The Changing Wealth of Nations: Measuring Sustainable Development in the New Millennium" (2011).
Categories, topics:
Economy & Growth
Last updated:
apr 23, 2017
Indicators value changes by year
Meaning:
-0.16
Minimum:
-9.378
jan 1, 2011
Maximum:
4.813
jan 1, 2008
At the date of observation
Value
Absolute change
Change from the previous value
jan 1, 2006
3.35
+3.35
0.0%
jan 1, 2007
-3.568
-6.918
-206.5%
jan 1, 2008
4.813
+8.38
-234.89%
jan 1, 2009
-3.839
-8.651
-179.77%
jan 1, 2010
3.923
+7.762
-202.19%
jan 1, 2011
-9.378
-13.301
-339.06%
jan 1, 2012
3.911
+13.289
-141.7%
jan 1, 2013
-0.581
-4.492
-114.85%
jan 1, 2014
3.082
+3.663
-630.62%
jan 1, 2015
-3.313
-6.396
-207.5%
Ranking of countries by current statistics by years