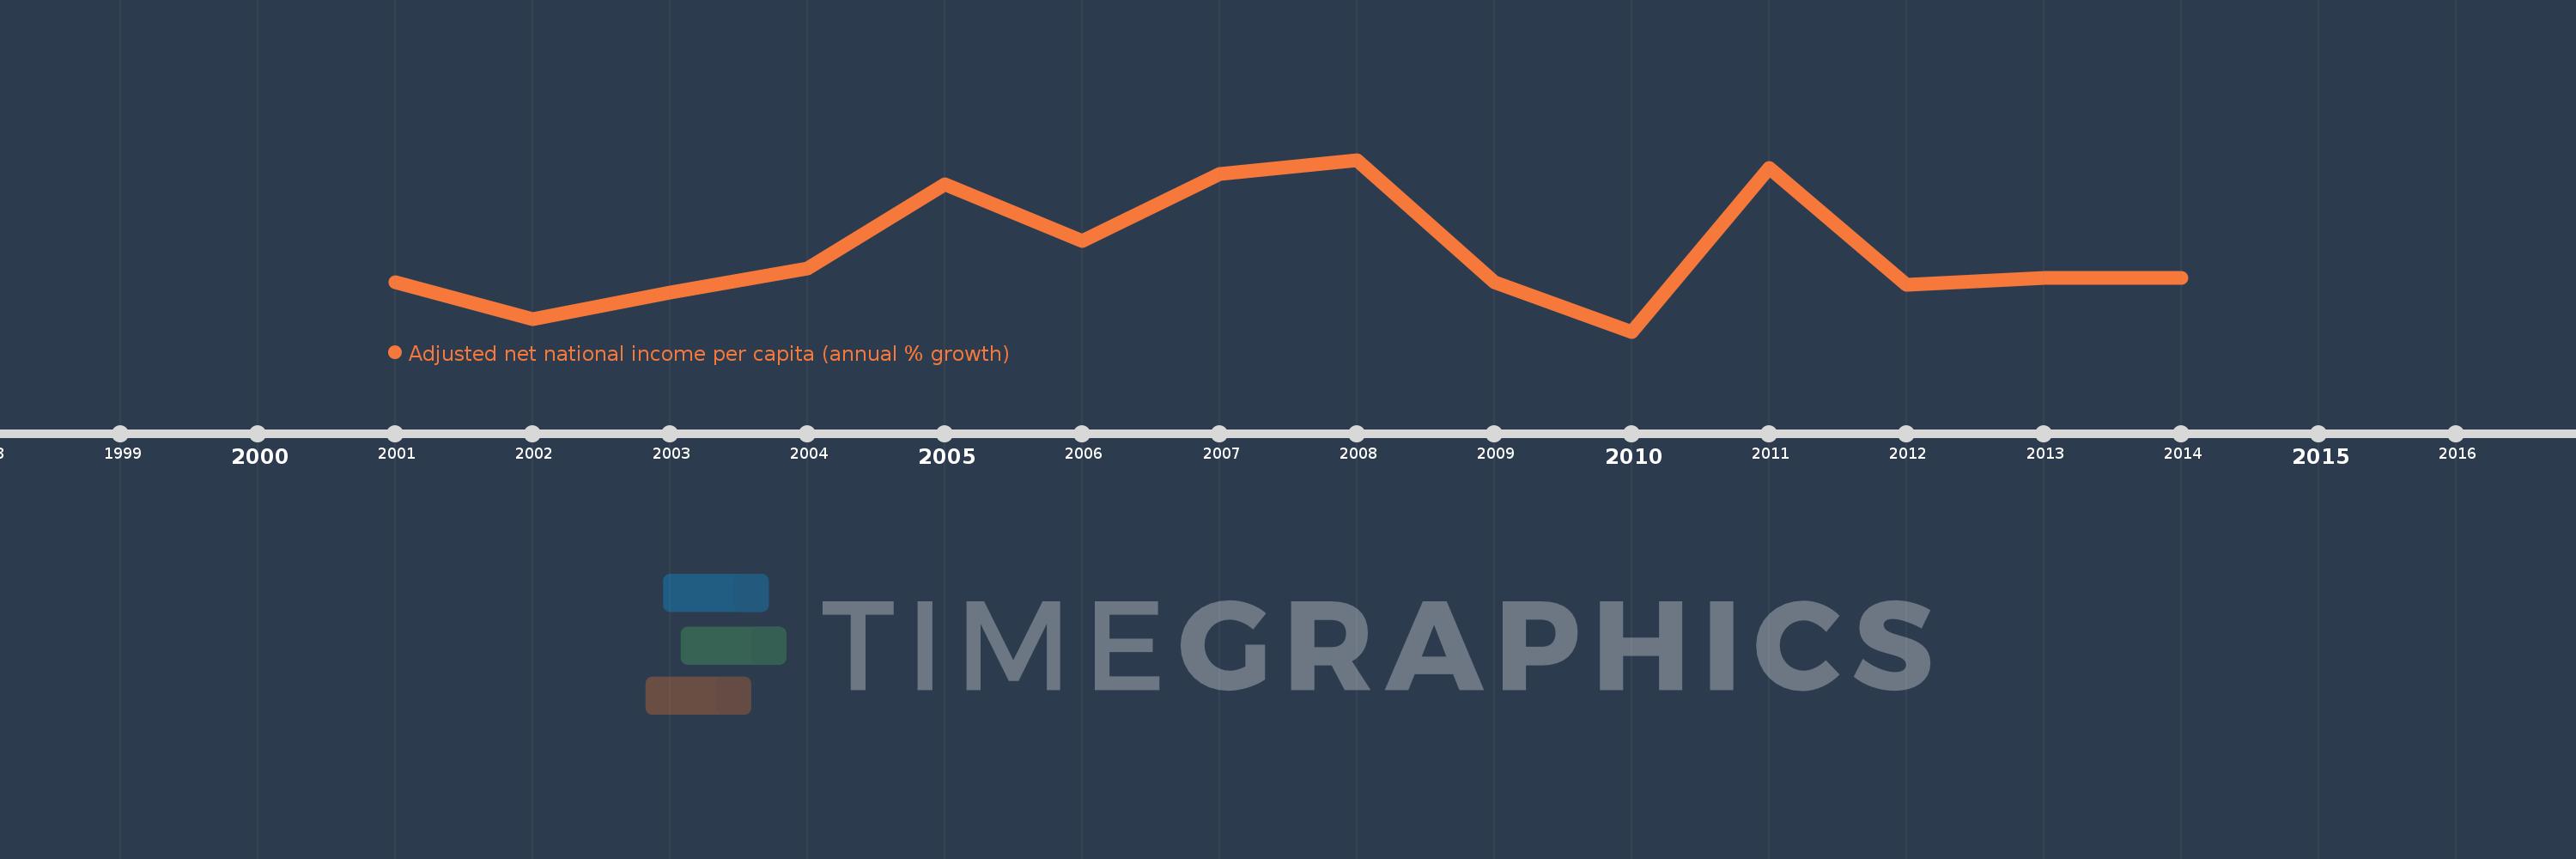
This timeline shows a graph from 2001 to 2014 of IDA & IBRD total. No data until 2000. Number of actual observations by date: 14.
Source name:
World Development Indicators
Source organization:
World Bank staff estimates based on sources and methods in World Bank's "The Changing Wealth of Nations: Measuring Sustainable Development in the New Millennium" (2011).
Categories, topics:
Economy & Growth
Last updated:
apr 23, 2017
Indicators value changes by year
Meaning:
3.296
Minimum:
-0.06
jan 1, 2010
Maximum:
7.292
jan 1, 2008
At the date of observation
Value
Absolute change
Change from the previous value
jan 1, 2001
2.056
+2.056
0.0%
jan 1, 2002
0.464
-1.592
-77.41%
jan 1, 2003
1.613
+1.148
247.24%
jan 1, 2004
2.659
+1.047
64.9%
jan 1, 2005
6.239
+3.58
134.63%
jan 1, 2006
3.802
-2.437
-39.06%
jan 1, 2007
6.669
+2.866
75.39%
jan 1, 2008
7.292
+0.624
9.35%
jan 1, 2009
2.072
-5.22
-71.59%
jan 1, 2010
-0.06
-2.132
-102.89%
jan 1, 2011
6.939
+6.999
-11.67K%
jan 1, 2012
1.945
-4.994
-71.97%
jan 1, 2013
2.222
+0.277
14.24%
jan 1, 2014
2.232
+0.011
0.48%
Ranking of countries by current statistics by years