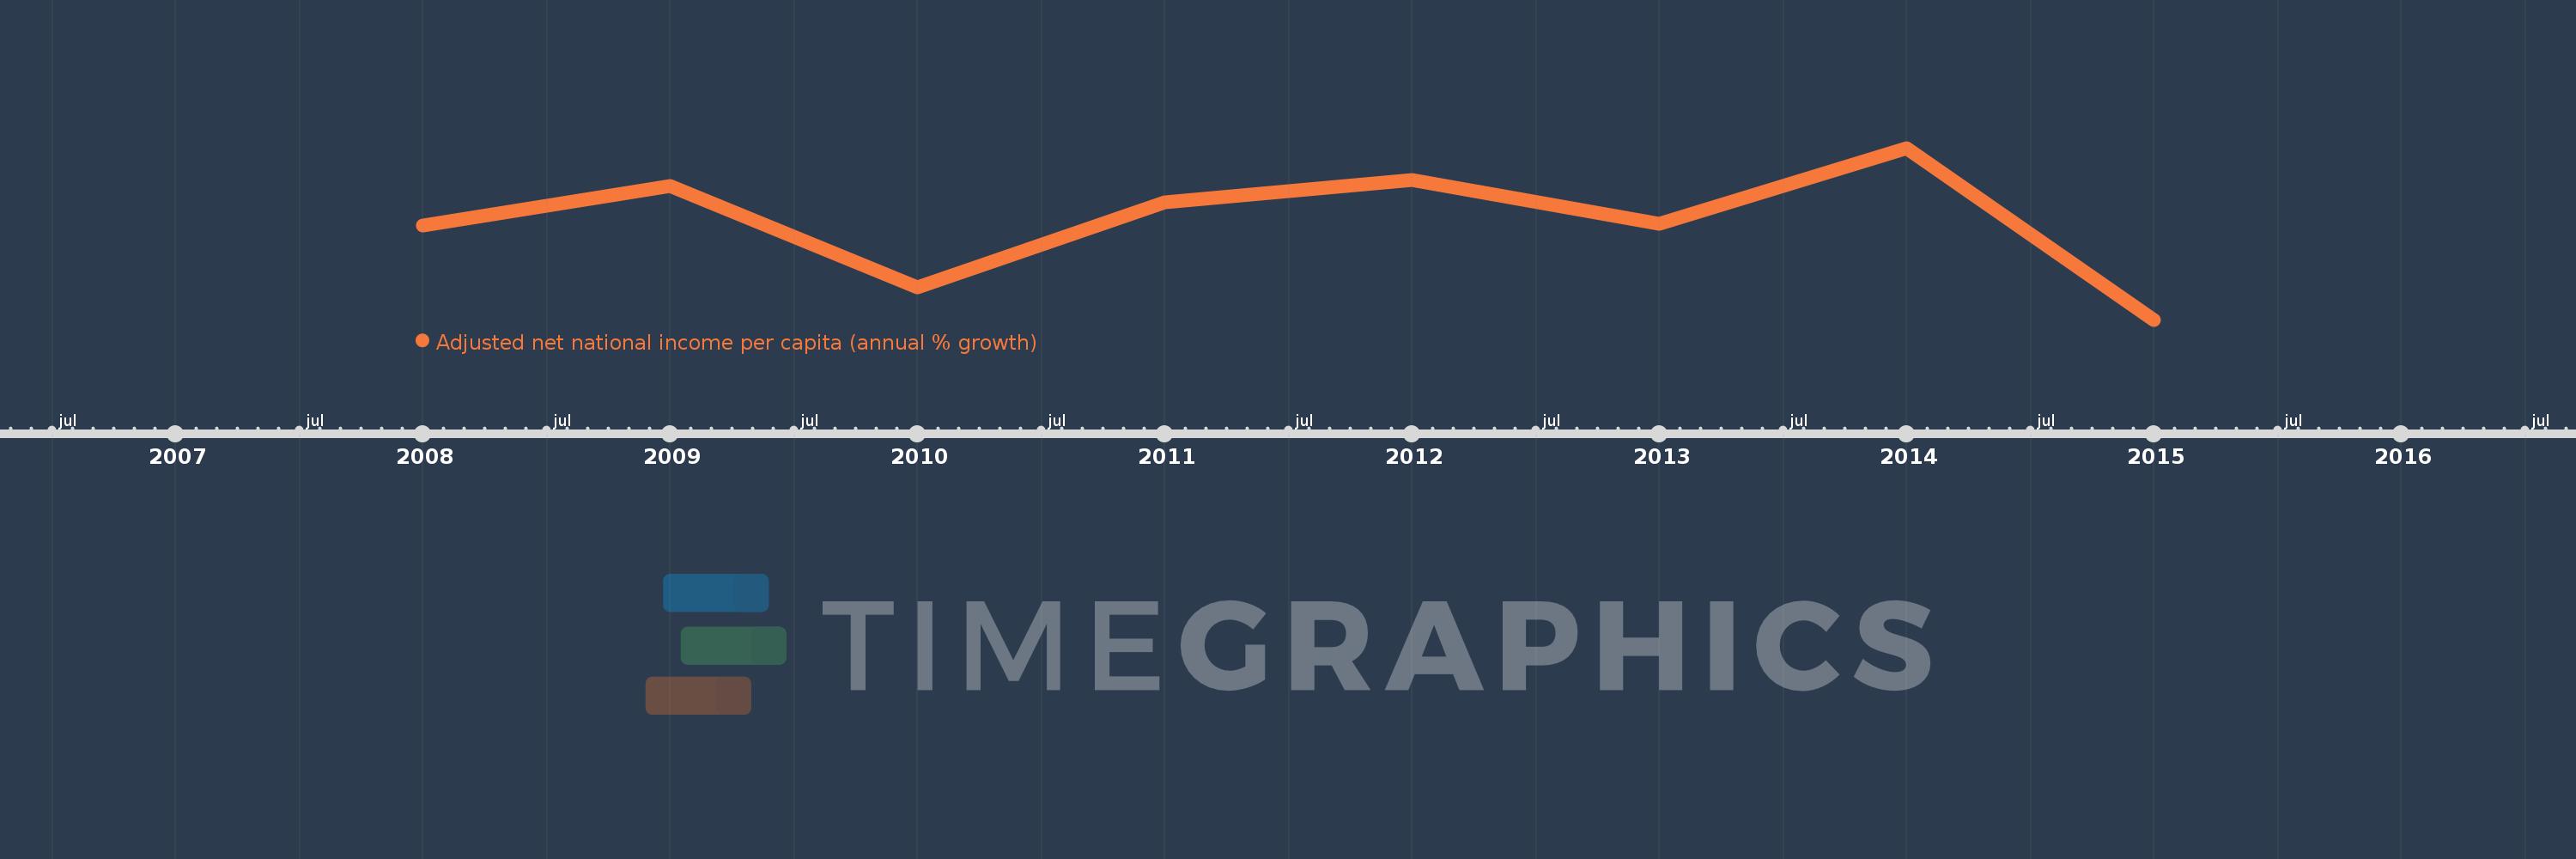
This timeline shows a graph from 2008 to 2015 of Ghana. No data until 2007. Number of actual observations by date: 8.
Source name:
World Development Indicators
Source organization:
World Bank staff estimates based on sources and methods in World Bank's "The Changing Wealth of Nations: Measuring Sustainable Development in the New Millennium" (2011).
Categories, topics:
Economy & Growth
Last updated:
apr 23, 2017
Indicators value changes by year
Meaning:
3.08
Minimum:
-7.233
jan 1, 2015
Maximum:
10.811
jan 1, 2014
At the date of observation
Value
Absolute change
Change from the previous value
jan 1, 2008
2.693
+2.693
0.0%
jan 1, 2009
6.776
+4.084
151.67%
jan 1, 2010
-3.844
-10.62
-156.72%
jan 1, 2011
5.133
+8.977
-233.54%
jan 1, 2012
7.48
+2.348
45.74%
jan 1, 2013
2.827
-4.653
-62.2%
jan 1, 2014
10.811
+7.984
282.37%
jan 1, 2015
-7.233
-18.045
-166.91%
Ranking of countries by current statistics by years