29
/
en
AIzaSyAYiBZKx7MnpbEhh9jyipgxe19OcubqV5w
April 1, 2024
98151
Cambodia
KHM
true
2
1
Adjusted net national income (current US$)
2015,2014,2013,2012,2011,2010,2009,2008,2007,2006,2005,2004,2003,2002,2001,2000,1999,1998,1997,1996,1975,1974,1973,1972,1971
Download
Global statistics library →Cambodia →

Adjusted net national income (current US$)

This statistics in other country:
AfghanistanAlbaniaAlgeriaAngolaArab WorldArgentinaArmeniaAustraliaAustriaAzerbaijanBahamas, TheBahrainBangladeshBarbadosBelarusBelgiumBelizeBeninBhutanBoliviaBotswanaBrazilBrunei DarussalamBulgariaBurkina FasoBurundiCabo VerdeCambodiaCameroonCanadaCaribbean small statesCentral African RepublicCentral Europe and the BalticsChadChileChinaColombiaComorosCongo, Dem. Rep.Congo, Rep.Costa RicaCote d'IvoireCroatiaCubaCyprusCzech RepublicDenmarkDjiboutiDominicaDominican RepublicEarly-demographic dividendEast Asia & PacificEast Asia & Pacific (excluding high income)East Asia & Pacific (IDA & IBRD countries)EcuadorEgypt, Arab Rep.El SalvadorEquatorial GuineaEritreaEstoniaEthiopiaEuro areaEurope & Central AsiaEurope & Central Asia (excluding high income)Europe & Central Asia (IDA & IBRD countries)European UnionFijiFinlandFragile and conflict affected situationsFranceGabonGambia, TheGeorgiaGermanyGhanaGreeceGuatemalaGuineaGuinea-BissauGuyanaHaitiHeavily indebted poor countries (HIPC)High incomeHondurasHong Kong SAR, ChinaHungaryIBRD onlyIcelandIDA & IBRD totalIDA blendIDA onlyIDA totalIndiaIndonesiaIran, Islamic Rep.IraqIrelandIsraelItalyJamaicaJapanJordanKazakhstanKenyaKiribatiKorea, Rep.KuwaitKyrgyz RepublicLao PDRLate-demographic dividendLatin America & Caribbean Latin America & Caribbean (excluding high income)Latin America & the Caribbean (IDA & IBRD countries)LatviaLeast developed countries: UN classificationLebanonLesothoLiberiaLibyaLithuaniaLow & middle incomeLow incomeLower middle incomeLuxembourgMacedonia, FYRMadagascarMalawiMalaysiaMaldivesMaliMauritaniaMauritiusMexicoMiddle East & North AfricaMiddle East & North Africa (excluding high income)Middle East & North Africa (IDA & IBRD countries)Middle incomeMoldovaMongoliaMoroccoMozambiqueMyanmarNamibiaNepalNetherlandsNew ZealandNicaraguaNigerNigeriaNorth AmericaNorwayOECD membersOmanOther small statesPacific island small statesPakistanPanamaPapua New GuineaParaguayPeruPhilippinesPolandPortugalPost-demographic dividendPre-demographic dividendQatarRomaniaRussian FederationRwandaSamoaSao Tome and PrincipeSaudi ArabiaSenegalSeychellesSierra LeoneSingaporeSlovak RepublicSloveniaSmall statesSolomon IslandsSouth AfricaSouth AsiaSouth Asia (IDA & IBRD)SpainSri LankaSt. LuciaSt. Vincent and the GrenadinesSub-Saharan Africa Sub-Saharan Africa (excluding high income)Sub-Saharan Africa (IDA & IBRD countries)SudanSurinameSwazilandSwedenSwitzerlandSyrian Arab RepublicTajikistanTanzaniaThailandTogoTongaTrinidad and TobagoTunisiaTurkeyTurkmenistanUgandaUkraineUnited Arab EmiratesUnited KingdomUnited StatesUpper middle incomeUruguayUzbekistanVanuatuVenezuela, RBVietnamWorldYemen, Rep.ZambiaZimbabwe
Timeline:
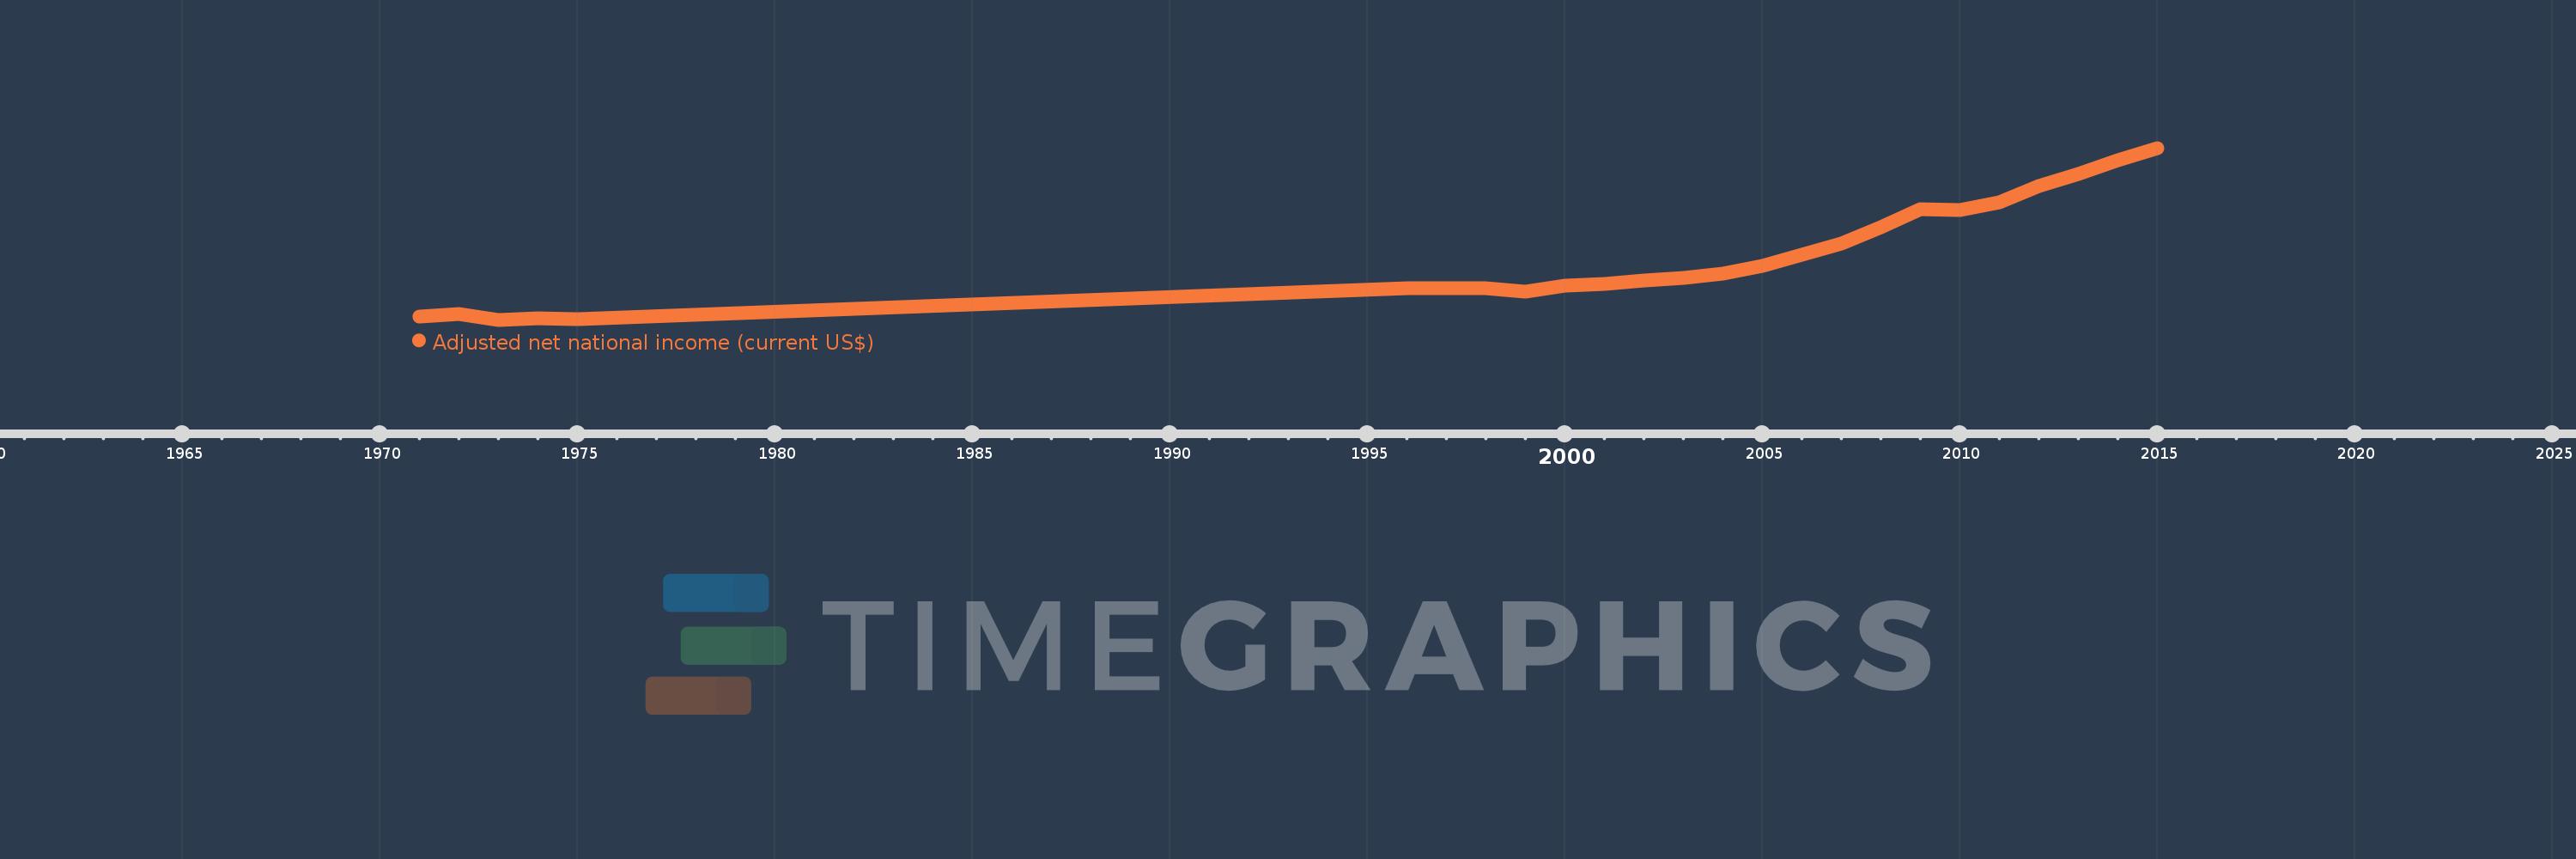
This timeline shows a graph from 1971 to 2015 of Cambodia. No data until 1970. Number of actual observations by date: 25.
Source name:
World Development Indicators
Source organization:
World Bank staff estimates based on sources and methods in World Bank's "The Changing Wealth of Nations: Measuring Sustainable Development in the New Millennium" (2011).
Categories, topics:
Economy & Growth
Last updated:
apr 23, 2017
Indicators value changes by year
Mean:
5.263 bln
Minimum:
444.14 mln
jan 1, 1973
Maximum:
13.647 bln
jan 1, 2015
At the date of observation
Value
Absolute change
Change from previous value
jan 1, 1971
678.083 mln
+678.083 mln
0.0%
jan 1, 1972
865.614 mln
+187.531 mln
27.66%
jan 1, 1973
444.14 mln
-421.474 mln
-48.69%
jan 1, 1974
588.027 mln
+143.887 mln
32.4%
jan 1, 1975
488.006 mln
-100.021 mln
-17.01%
jan 1, 1996
2.854 bln
+2.366 bln
484.84%
jan 1, 1997
2.847 bln
-7.474 mln
-0.26%
jan 1, 1998
2.888 bln
+41.383 mln
1.45%
jan 1, 1999
2.619 bln
-269.376 mln
-9.33%
jan 1, 2000
3.051 bln
+432.097 mln
16.5%
jan 1, 2001
3.189 bln
+138.566 mln
4.54%
jan 1, 2002
3.459 bln
+269.506 mln
8.45%
jan 1, 2003
3.686 bln
+227.515 mln
6.58%
jan 1, 2004
3.991 bln
+305.072 mln
8.28%
jan 1, 2005
4.576 bln
+584.514 mln
14.64%
jan 1, 2006
5.469 bln
+892.831 mln
19.51%
jan 1, 2007
6.329 bln
+860.394 mln
15.73%
jan 1, 2008
7.563 bln
+1.234 bln
19.5%
jan 1, 2009
8.921 bln
+1.358 bln
17.96%
jan 1, 2010
8.848 bln
-72.752 mln
-0.82%
jan 1, 2011
9.448 bln
+599.903 mln
6.78%
jan 1, 2012
10.74 bln
+1.292 bln
13.68%
jan 1, 2013
11.65 bln
+909.983 mln
8.47%
jan 1, 2014
12.73 bln
+1.08 bln
9.27%
jan 1, 2015
13.647 bln
+916.463 mln
7.2%
Ranking of countries by current statistics by years

Comments:

Send
PremiumAbout & FeedbackTermsPrivacy
logo
© 2022 Selected Technologies LLC – Morgan Hill, California