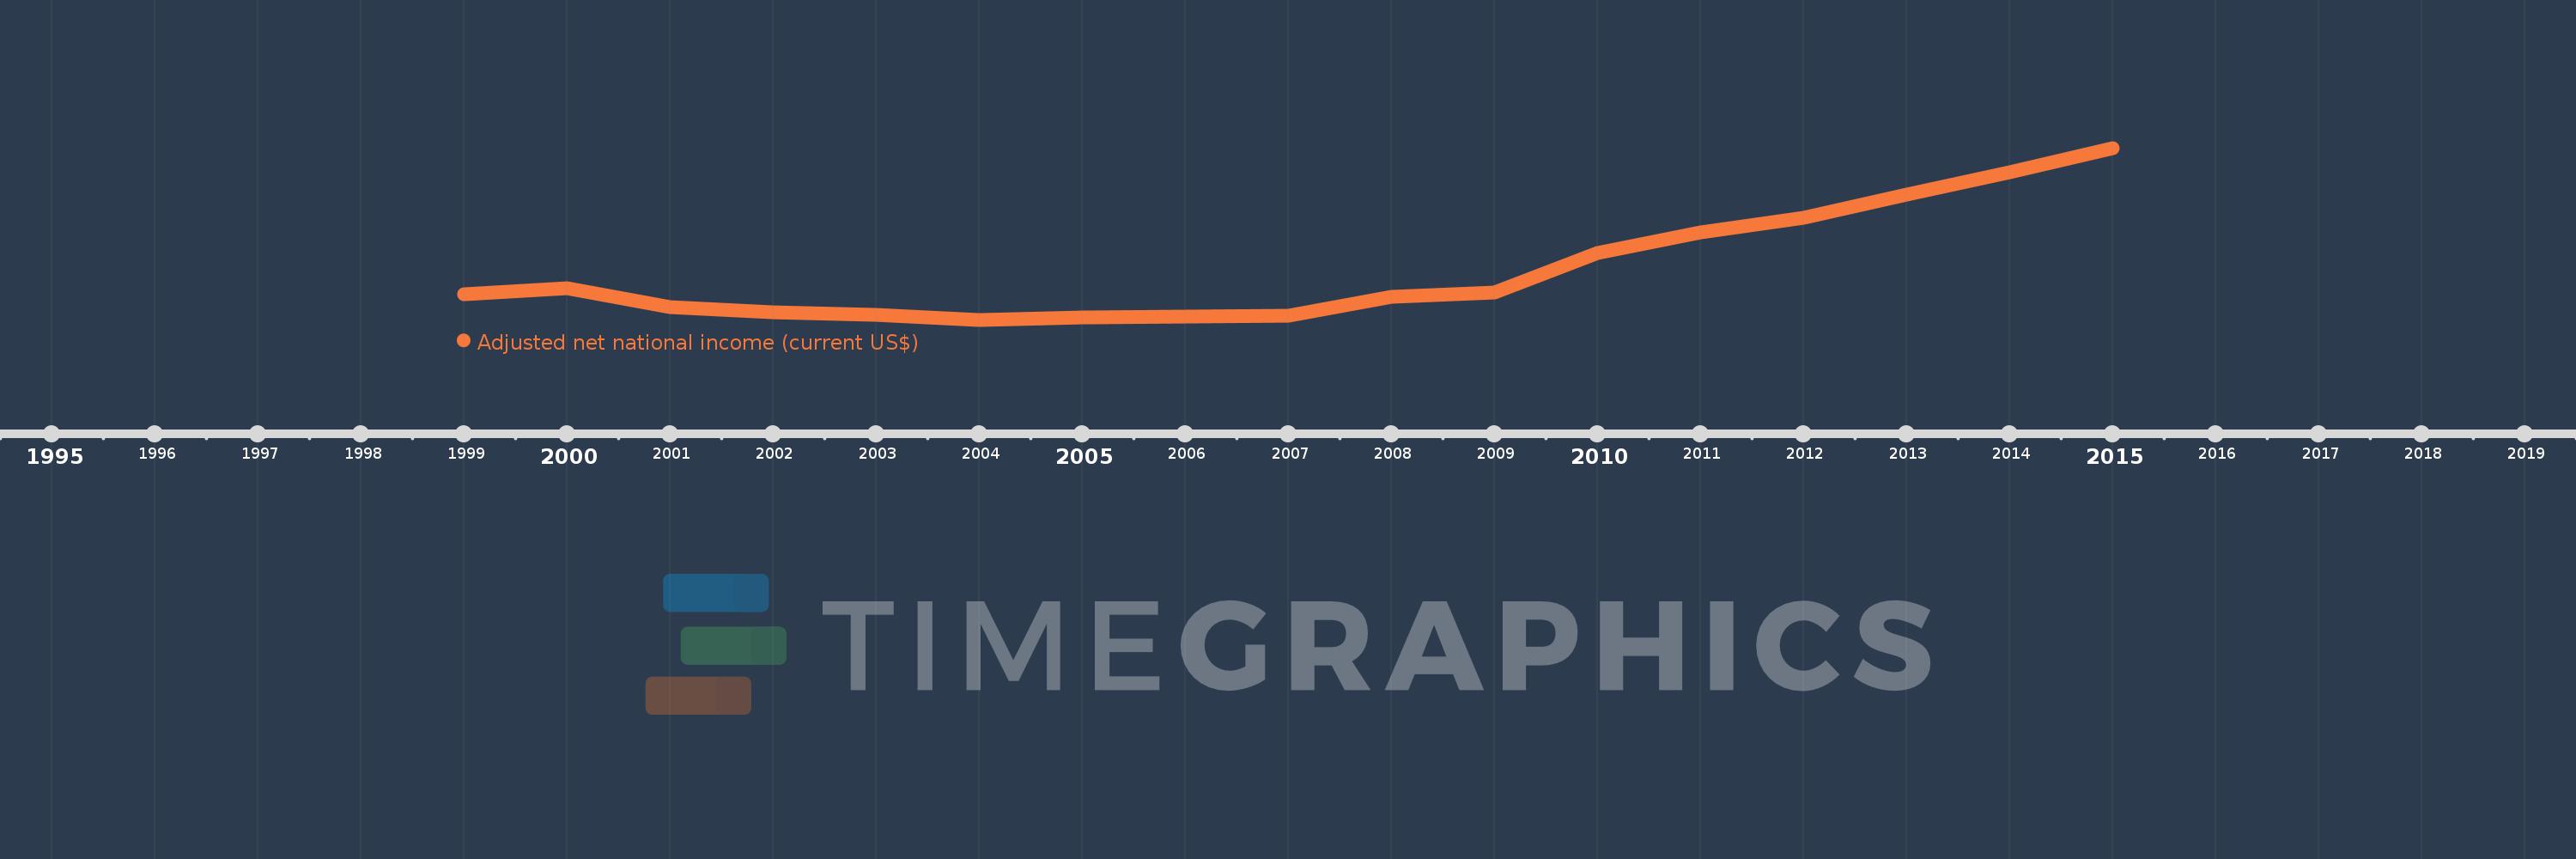
This timeline shows a graph from 1999 to 2015 of Uzbekistan. No data until 1998. Number of actual observations by date: 16.
Source name:
World Development Indicators
Source organization:
World Bank staff estimates based on sources and methods in World Bank's "The Changing Wealth of Nations: Measuring Sustainable Development in the New Millennium" (2011).
Categories, topics:
Economy & Growth
Last updated:
apr 23, 2017
Indicators value changes by year
Meaning:
20.087 bln
Minimum:
3.827 bln
jan 1, 2004
Maximum:
57.028 bln
jan 1, 2015
At the date of observation
Value
Absolute change
Change from the previous value
jan 1, 1999
11.778 bln
+11.778 bln
0.0%
jan 1, 2000
13.72 bln
+1.942 bln
16.48%
jan 1, 2001
7.813 bln
-5.907 bln
-43.05%
jan 1, 2002
6.009 bln
-1.804 bln
-23.09%
jan 1, 2003
5.433 bln
-576.64 mln
-9.6%
jan 1, 2004
3.827 bln
-1.606 bln
-29.57%
jan 1, 2005
4.664 bln
+837.155 mln
21.88%
jan 1, 2007
5.067 bln
+403.722 mln
8.66%
jan 1, 2008
10.956 bln
+5.889 bln
116.21%
jan 1, 2009
12.166 bln
+1.209 bln
11.04%
jan 1, 2010
24.487 bln
+12.321 bln
101.28%
jan 1, 2011
30.94 bln
+6.453 bln
26.35%
jan 1, 2012
35.421 bln
+4.481 bln
14.48%
jan 1, 2013
42.714 bln
+7.293 bln
20.59%
jan 1, 2014
49.372 bln
+6.659 bln
15.59%
jan 1, 2015
57.028 bln
+7.656 bln
15.51%
Ranking of countries by current statistics by years