29
/
en
AIzaSyAYiBZKx7MnpbEhh9jyipgxe19OcubqV5w
April 1, 2024
80132
Belarus
BLR
true
2
1
Adjusted net national income (current US$)
2015,2014,2013,2012,2011,2010,2009,2008,2007,2006,2005,2004,2003,2002,2001,2000,1999,1998,1997,1996,1995,1994,1993
Download
Global statistics library →Belarus →

Adjusted net national income (current US$)

This statistics in other country:
AfghanistanAlbaniaAlgeriaAngolaArab WorldArgentinaArmeniaAustraliaAustriaAzerbaijanBahamas, TheBahrainBangladeshBarbadosBelarusBelgiumBelizeBeninBhutanBoliviaBotswanaBrazilBrunei DarussalamBulgariaBurkina FasoBurundiCabo VerdeCambodiaCameroonCanadaCaribbean small statesCentral African RepublicCentral Europe and the BalticsChadChileChinaColombiaComorosCongo, Dem. Rep.Congo, Rep.Costa RicaCote d'IvoireCroatiaCubaCyprusCzech RepublicDenmarkDjiboutiDominicaDominican RepublicEarly-demographic dividendEast Asia & PacificEast Asia & Pacific (excluding high income)East Asia & Pacific (IDA & IBRD countries)EcuadorEgypt, Arab Rep.El SalvadorEquatorial GuineaEritreaEstoniaEthiopiaEuro areaEurope & Central AsiaEurope & Central Asia (excluding high income)Europe & Central Asia (IDA & IBRD countries)European UnionFijiFinlandFragile and conflict affected situationsFranceGabonGambia, TheGeorgiaGermanyGhanaGreeceGuatemalaGuineaGuinea-BissauGuyanaHaitiHeavily indebted poor countries (HIPC)High incomeHondurasHong Kong SAR, ChinaHungaryIBRD onlyIcelandIDA & IBRD totalIDA blendIDA onlyIDA totalIndiaIndonesiaIran, Islamic Rep.IraqIrelandIsraelItalyJamaicaJapanJordanKazakhstanKenyaKiribatiKorea, Rep.KuwaitKyrgyz RepublicLao PDRLate-demographic dividendLatin America & Caribbean Latin America & Caribbean (excluding high income)Latin America & the Caribbean (IDA & IBRD countries)LatviaLeast developed countries: UN classificationLebanonLesothoLiberiaLibyaLithuaniaLow & middle incomeLow incomeLower middle incomeLuxembourgMacedonia, FYRMadagascarMalawiMalaysiaMaldivesMaliMauritaniaMauritiusMexicoMiddle East & North AfricaMiddle East & North Africa (excluding high income)Middle East & North Africa (IDA & IBRD countries)Middle incomeMoldovaMongoliaMoroccoMozambiqueMyanmarNamibiaNepalNetherlandsNew ZealandNicaraguaNigerNigeriaNorth AmericaNorwayOECD membersOmanOther small statesPacific island small statesPakistanPanamaPapua New GuineaParaguayPeruPhilippinesPolandPortugalPost-demographic dividendPre-demographic dividendQatarRomaniaRussian FederationRwandaSamoaSao Tome and PrincipeSaudi ArabiaSenegalSeychellesSierra LeoneSingaporeSlovak RepublicSloveniaSmall statesSolomon IslandsSouth AfricaSouth AsiaSouth Asia (IDA & IBRD)SpainSri LankaSt. LuciaSt. Vincent and the GrenadinesSub-Saharan Africa Sub-Saharan Africa (excluding high income)Sub-Saharan Africa (IDA & IBRD countries)SudanSurinameSwazilandSwedenSwitzerlandSyrian Arab RepublicTajikistanTanzaniaThailandTogoTongaTrinidad and TobagoTunisiaTurkeyTurkmenistanUgandaUkraineUnited Arab EmiratesUnited KingdomUnited StatesUpper middle incomeUruguayUzbekistanVanuatuVenezuela, RBVietnamWorldYemen, Rep.ZambiaZimbabwe
Timeline:
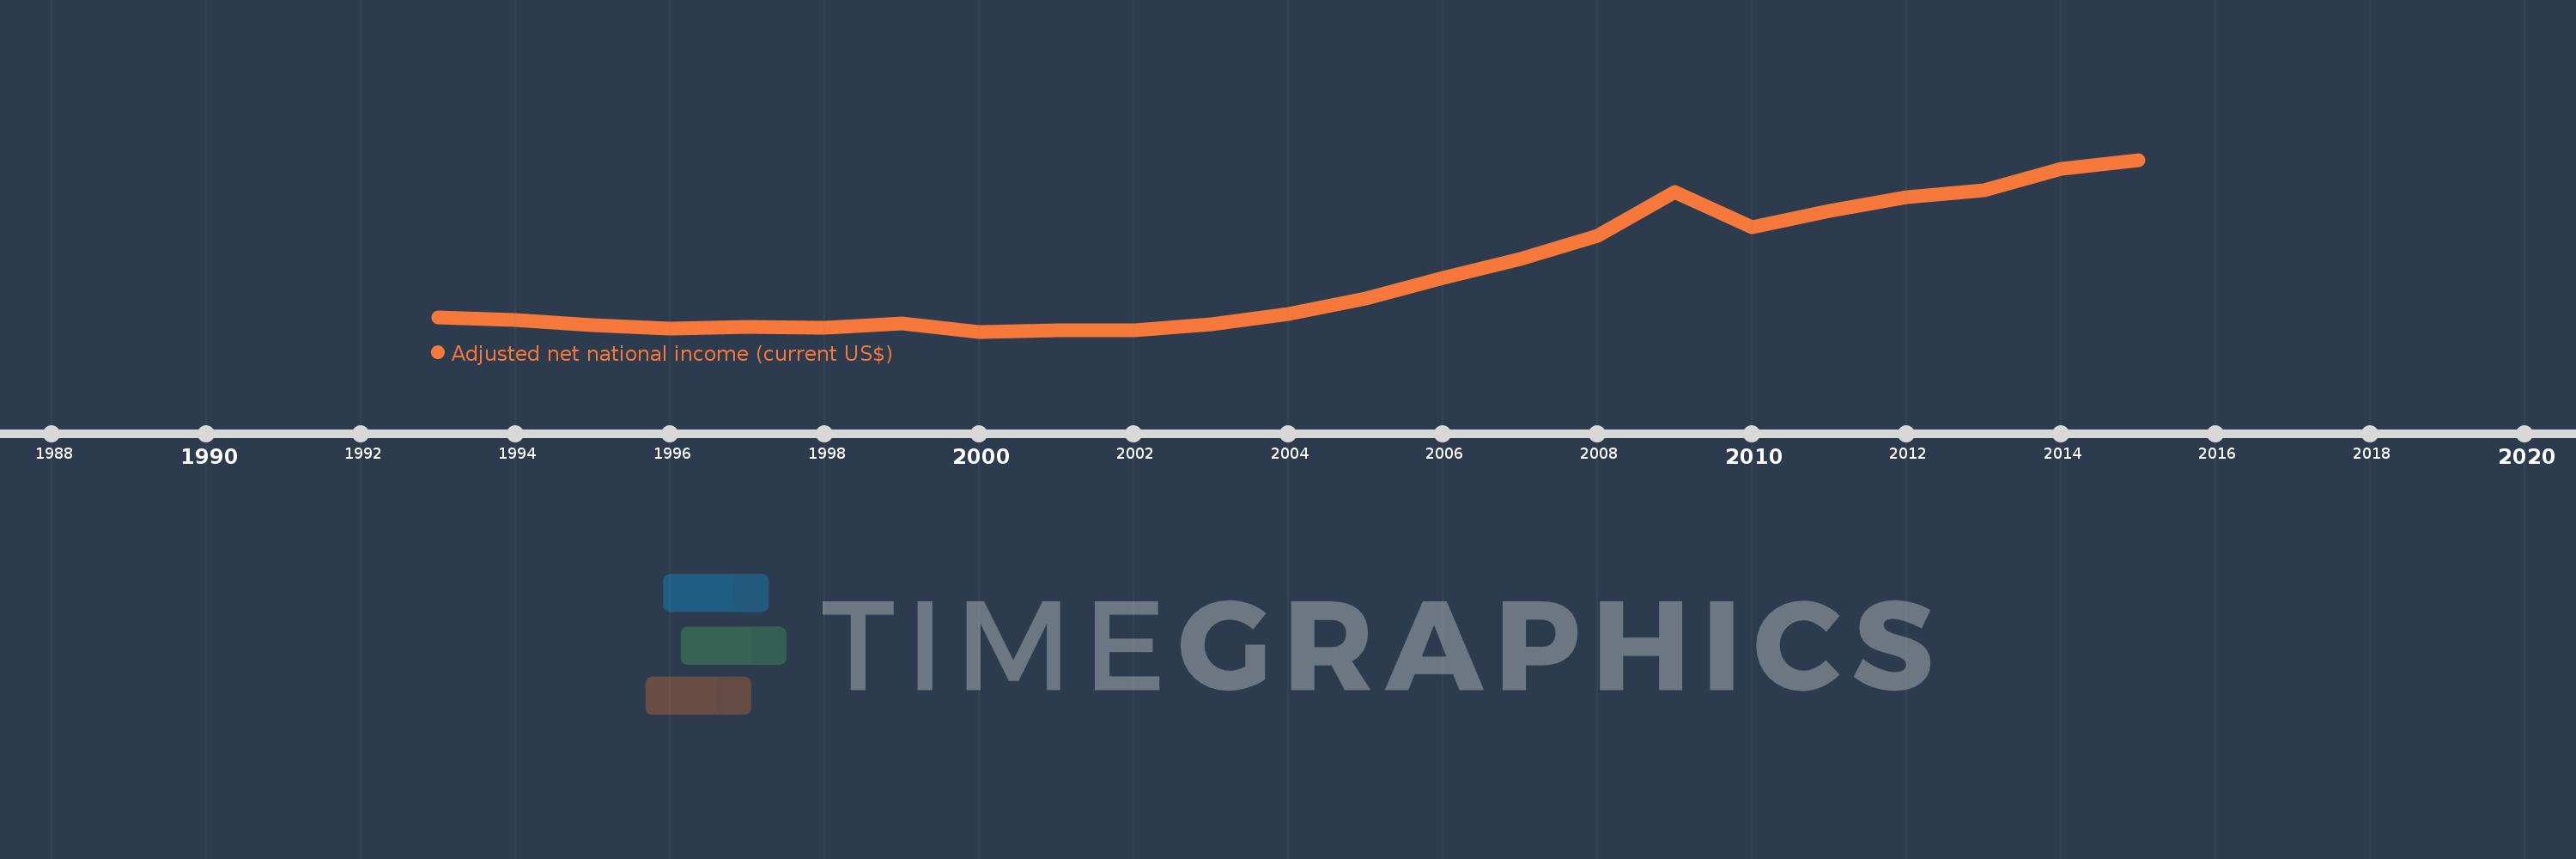
This timeline shows a graph from 1993 to 2015 of Belarus. No data until 1992. Number of actual observations by date: 23.
Source name:
World Development Indicators
Source organization:
World Bank staff estimates based on sources and methods in World Bank's "The Changing Wealth of Nations: Measuring Sustainable Development in the New Millennium" (2011).
Categories, topics:
Economy & Growth
Last updated:
apr 23, 2017
Indicators value changes by year
Mean:
28.259 bln
Minimum:
10.456 bln
jan 1, 2000
Maximum:
64.09 bln
jan 1, 2015
At the date of observation
Value
Absolute change
Change from previous value
jan 1, 1993
14.931 bln
+14.931 bln
0.0%
jan 1, 1994
14.051 bln
-879.102 mln
-5.89%
jan 1, 1995
12.558 bln
-1.494 bln
-10.63%
jan 1, 1996
11.44 bln
-1.118 bln
-8.9%
jan 1, 1997
11.997 bln
+557.088 mln
4.87%
jan 1, 1998
11.683 bln
-313.463 mln
-2.61%
jan 1, 1999
13.088 bln
+1.405 bln
12.02%
jan 1, 2000
10.456 bln
-2.632 bln
-20.11%
jan 1, 2001
10.948 bln
+492.122 mln
4.71%
jan 1, 2002
10.73 bln
-218.854 mln
-2.0%
jan 1, 2003
12.829 bln
+2.099 bln
19.57%
jan 1, 2004
15.843 bln
+3.014 bln
23.49%
jan 1, 2005
20.741 bln
+4.898 bln
30.92%
jan 1, 2006
27.157 bln
+6.416 bln
30.93%
jan 1, 2007
33.207 bln
+6.05 bln
22.28%
jan 1, 2008
40.47 bln
+7.263 bln
21.87%
jan 1, 2009
54.132 bln
+13.662 bln
33.76%
jan 1, 2010
43.063 bln
-11.07 bln
-20.45%
jan 1, 2011
48.256 bln
+5.193 bln
12.06%
jan 1, 2012
52.372 bln
+4.117 bln
8.53%
jan 1, 2013
54.499 bln
+2.126 bln
4.06%
jan 1, 2014
61.406 bln
+6.908 bln
12.67%
jan 1, 2015
64.09 bln
+2.684 bln
4.37%
Ranking of countries by current statistics by years

Comments:

Send
PremiumAbout & FeedbackTermsPrivacy
logo
© 2022 Selected Technologies LLC – Morgan Hill, California