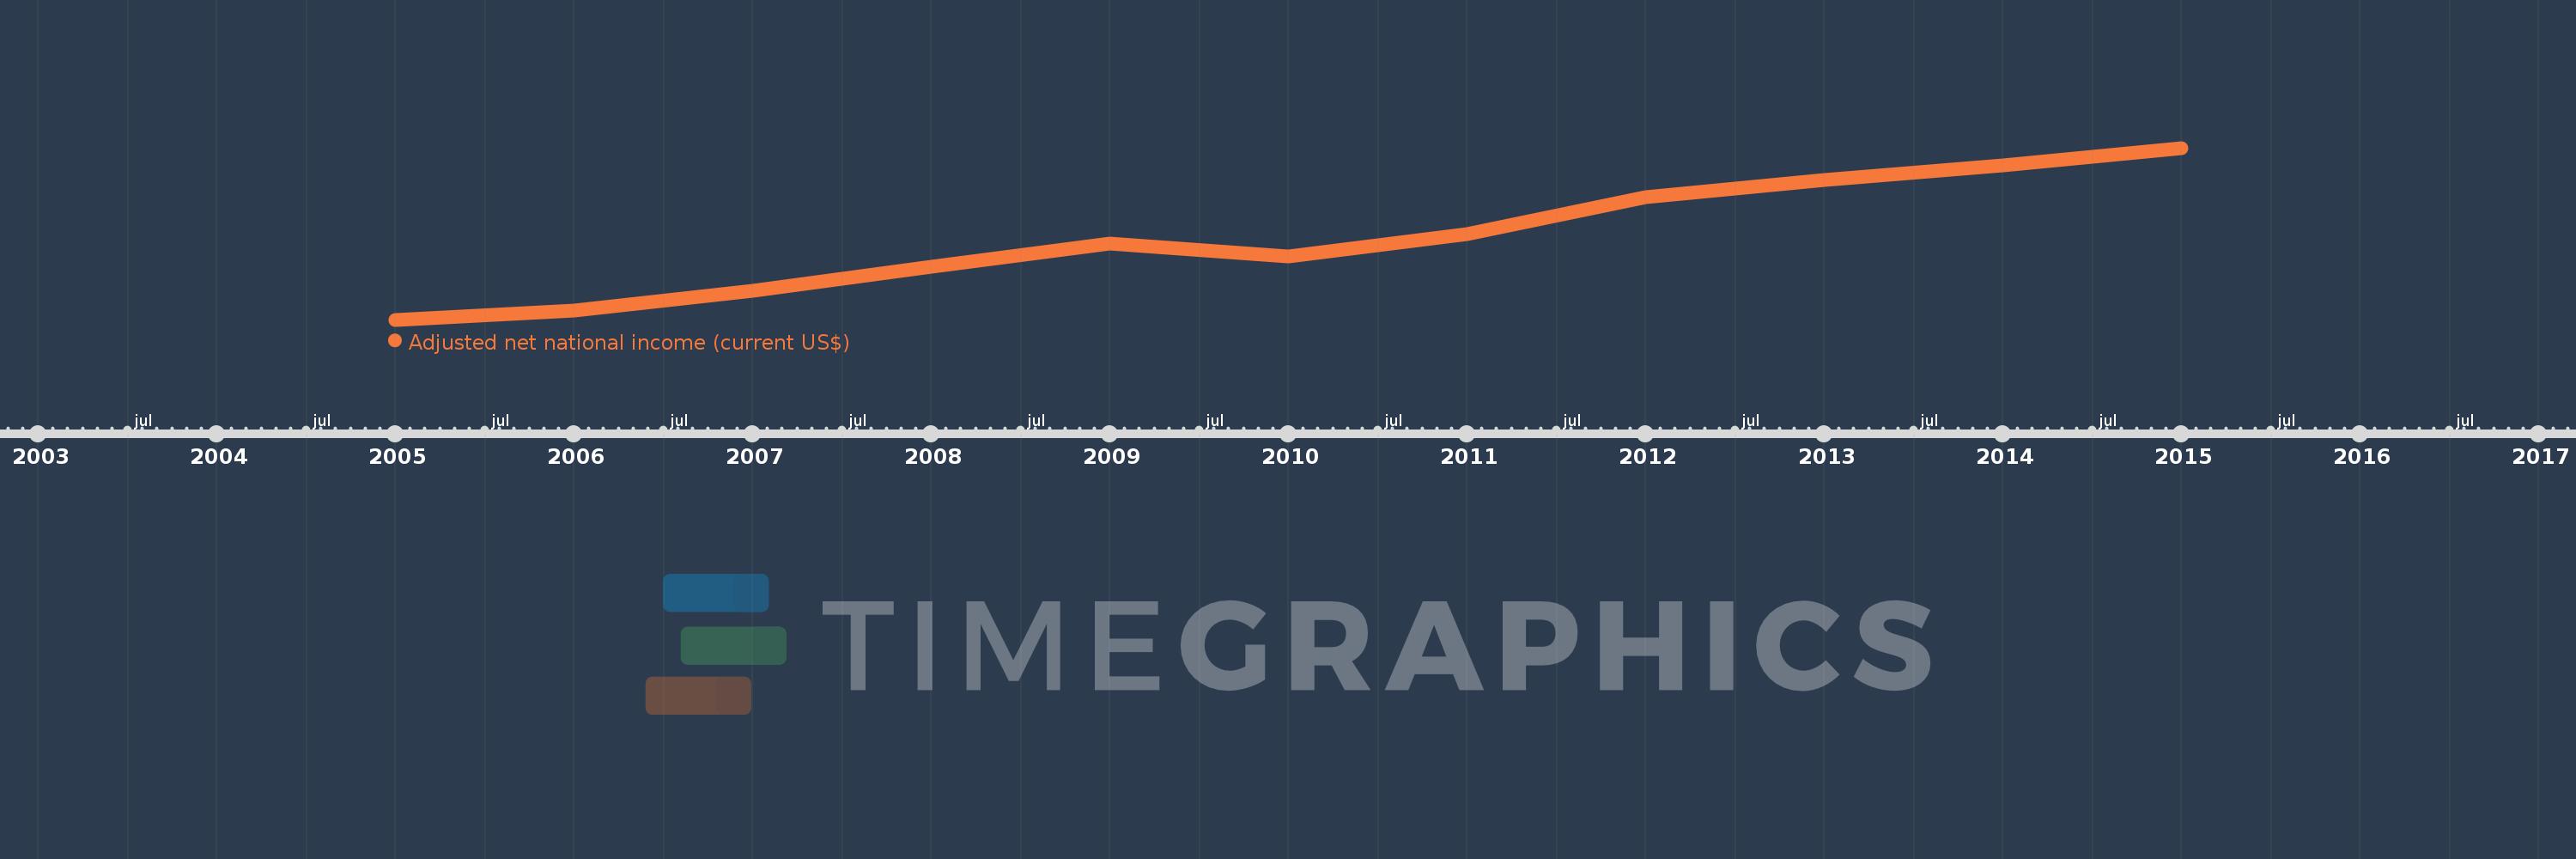
This timeline shows a graph from 2005 to 2015 of Other small states. No data until 2004. Number of actual observations by date: 11.
Source name:
World Development Indicators
Source organization:
World Bank staff estimates based on sources and methods in World Bank's "The Changing Wealth of Nations: Measuring Sustainable Development in the New Millennium" (2011).
Categories, topics:
Economy & Growth
Last updated:
apr 23, 2017
Indicators value changes by year
Meaning:
195.199 bln
Minimum:
96.561 bln
jan 1, 2005
Maximum:
302.611 bln
jan 1, 2015
At the date of observation
Value
Absolute change
Change from the previous value
jan 1, 2005
96.561 bln
+96.561 bln
0.0%
jan 1, 2006
107.17 bln
+10.609 bln
10.99%
jan 1, 2007
130.836 bln
+23.667 bln
22.08%
jan 1, 2008
160.428 bln
+29.592 bln
22.62%
jan 1, 2009
187.608 bln
+27.18 bln
16.94%
jan 1, 2010
172.939 bln
-14.669 bln
-7.82%
jan 1, 2011
199.212 bln
+26.273 bln
15.19%
jan 1, 2012
243.878 bln
+44.666 bln
22.42%
jan 1, 2013
264.445 bln
+20.567 bln
8.43%
jan 1, 2014
281.499 bln
+17.054 bln
6.45%
jan 1, 2015
302.611 bln
+21.112 bln
7.5%
Ranking of countries by current statistics by years