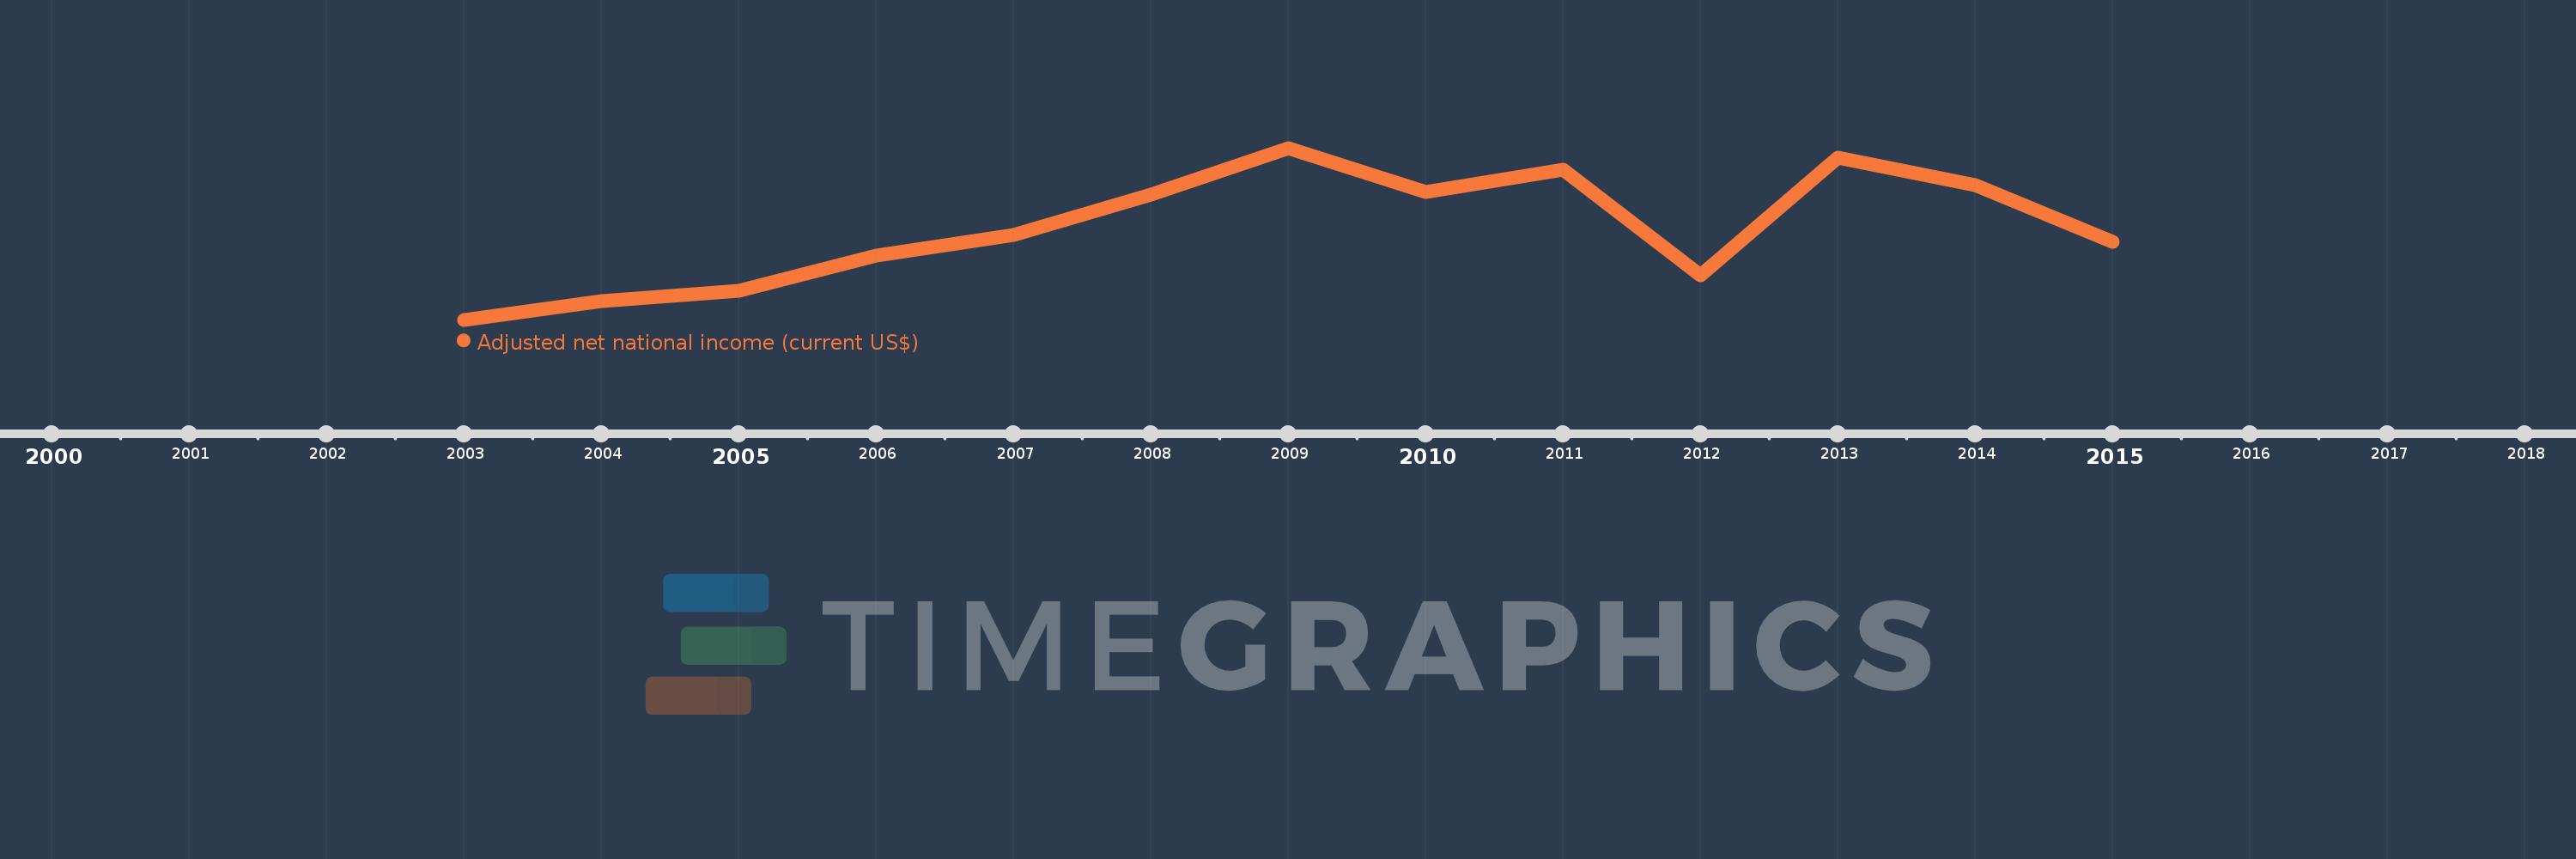
This timeline shows a graph from 2003 to 2015 of Libya. No data until 2002. Number of actual observations by date: 13.
Source name:
World Development Indicators
Source organization:
World Bank staff estimates based on sources and methods in World Bank's "The Changing Wealth of Nations: Measuring Sustainable Development in the New Millennium" (2011).
Categories, topics:
Economy & Growth
Last updated:
apr 23, 2017
Indicators value changes by year
Meaning:
34.985 bln
Minimum:
14.359 bln
jan 1, 2003
Maximum:
53.078 bln
jan 1, 2009
At the date of observation
Value
Absolute change
Change from the previous value
jan 1, 2003
14.359 bln
+14.359 bln
0.0%
jan 1, 2004
18.52 bln
+4.161 bln
28.98%
jan 1, 2005
20.868 bln
+2.348 bln
12.68%
jan 1, 2006
28.791 bln
+7.923 bln
37.97%
jan 1, 2007
33.459 bln
+4.669 bln
16.22%
jan 1, 2008
42.584 bln
+9.125 bln
27.27%
jan 1, 2009
53.078 bln
+10.494 bln
24.64%
jan 1, 2010
43.2 bln
-9.878 bln
-18.61%
jan 1, 2011
48.14 bln
+4.939 bln
11.43%
jan 1, 2012
24.284 bln
-23.855 bln
-49.55%
jan 1, 2013
50.919 bln
+26.634 bln
109.68%
jan 1, 2014
44.735 bln
-6.183 bln
-12.14%
jan 1, 2015
31.866 bln
-12.87 bln
-28.77%
Ranking of countries by current statistics by years