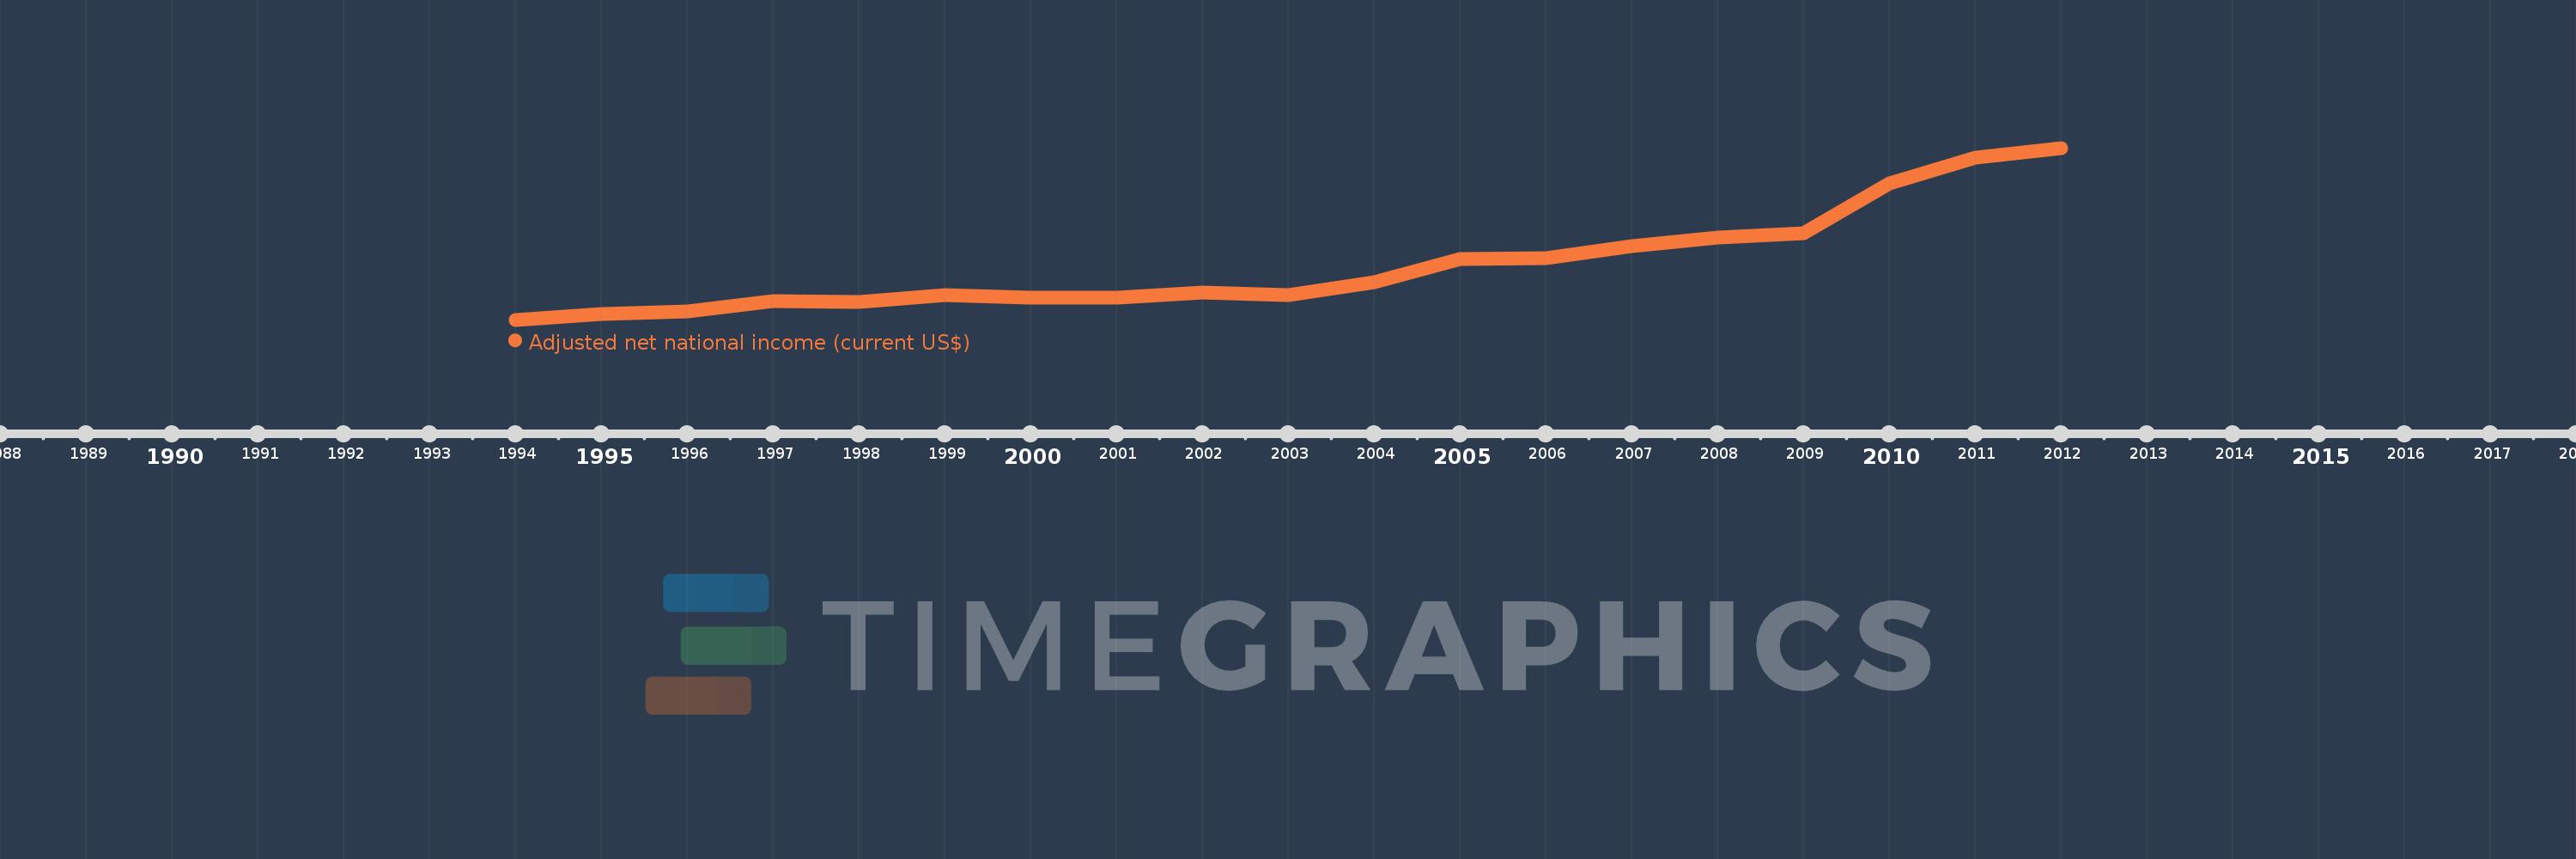
This timeline shows a graph from 1994 to 2012 of Eritrea. No data until 1993. Number of actual observations by date: 19.
Source name:
World Development Indicators
Source organization:
World Bank staff estimates based on sources and methods in World Bank's "The Changing Wealth of Nations: Measuring Sustainable Development in the New Millennium" (2011).
Categories, topics:
Economy & Growth
Last updated:
apr 23, 2017
Indicators value changes by year
Meaning:
893.425 mln
Minimum:
402.637 mln
jan 1, 1994
Maximum:
1.936 bln
jan 1, 2012
At the date of observation
Value
Absolute change
Change from the previous value
jan 1, 1994
402.637 mln
+402.637 mln
0.0%
jan 1, 1995
452.635 mln
+49.997 mln
12.42%
jan 1, 1996
480.814 mln
+28.179 mln
6.23%
jan 1, 1997
565.471 mln
+84.657 mln
17.61%
jan 1, 1998
562.153 mln
-3.317 mln
-0.59%
jan 1, 1999
623.325 mln
+61.172 mln
10.88%
jan 1, 2000
596.175 mln
-27.15 mln
-4.36%
jan 1, 2001
602.898 mln
+6.723 mln
1.13%
jan 1, 2002
642.303 mln
+39.405 mln
6.54%
jan 1, 2003
625.978 mln
-16.325 mln
-2.54%
jan 1, 2004
735.655 mln
+109.677 mln
17.52%
jan 1, 2005
947.829 mln
+212.173 mln
28.84%
jan 1, 2006
951.624 mln
+3.795 mln
0.4%
jan 1, 2007
1.059 bln
+107.7 mln
11.32%
jan 1, 2008
1.14 bln
+80.392 mln
7.59%
jan 1, 2009
1.178 bln
+37.852 mln
3.32%
jan 1, 2010
1.62 bln
+442.375 mln
37.57%
jan 1, 2011
1.853 bln
+232.993 mln
14.38%
jan 1, 2012
1.936 bln
+83.161 mln
4.49%
Ranking of countries by current statistics by years