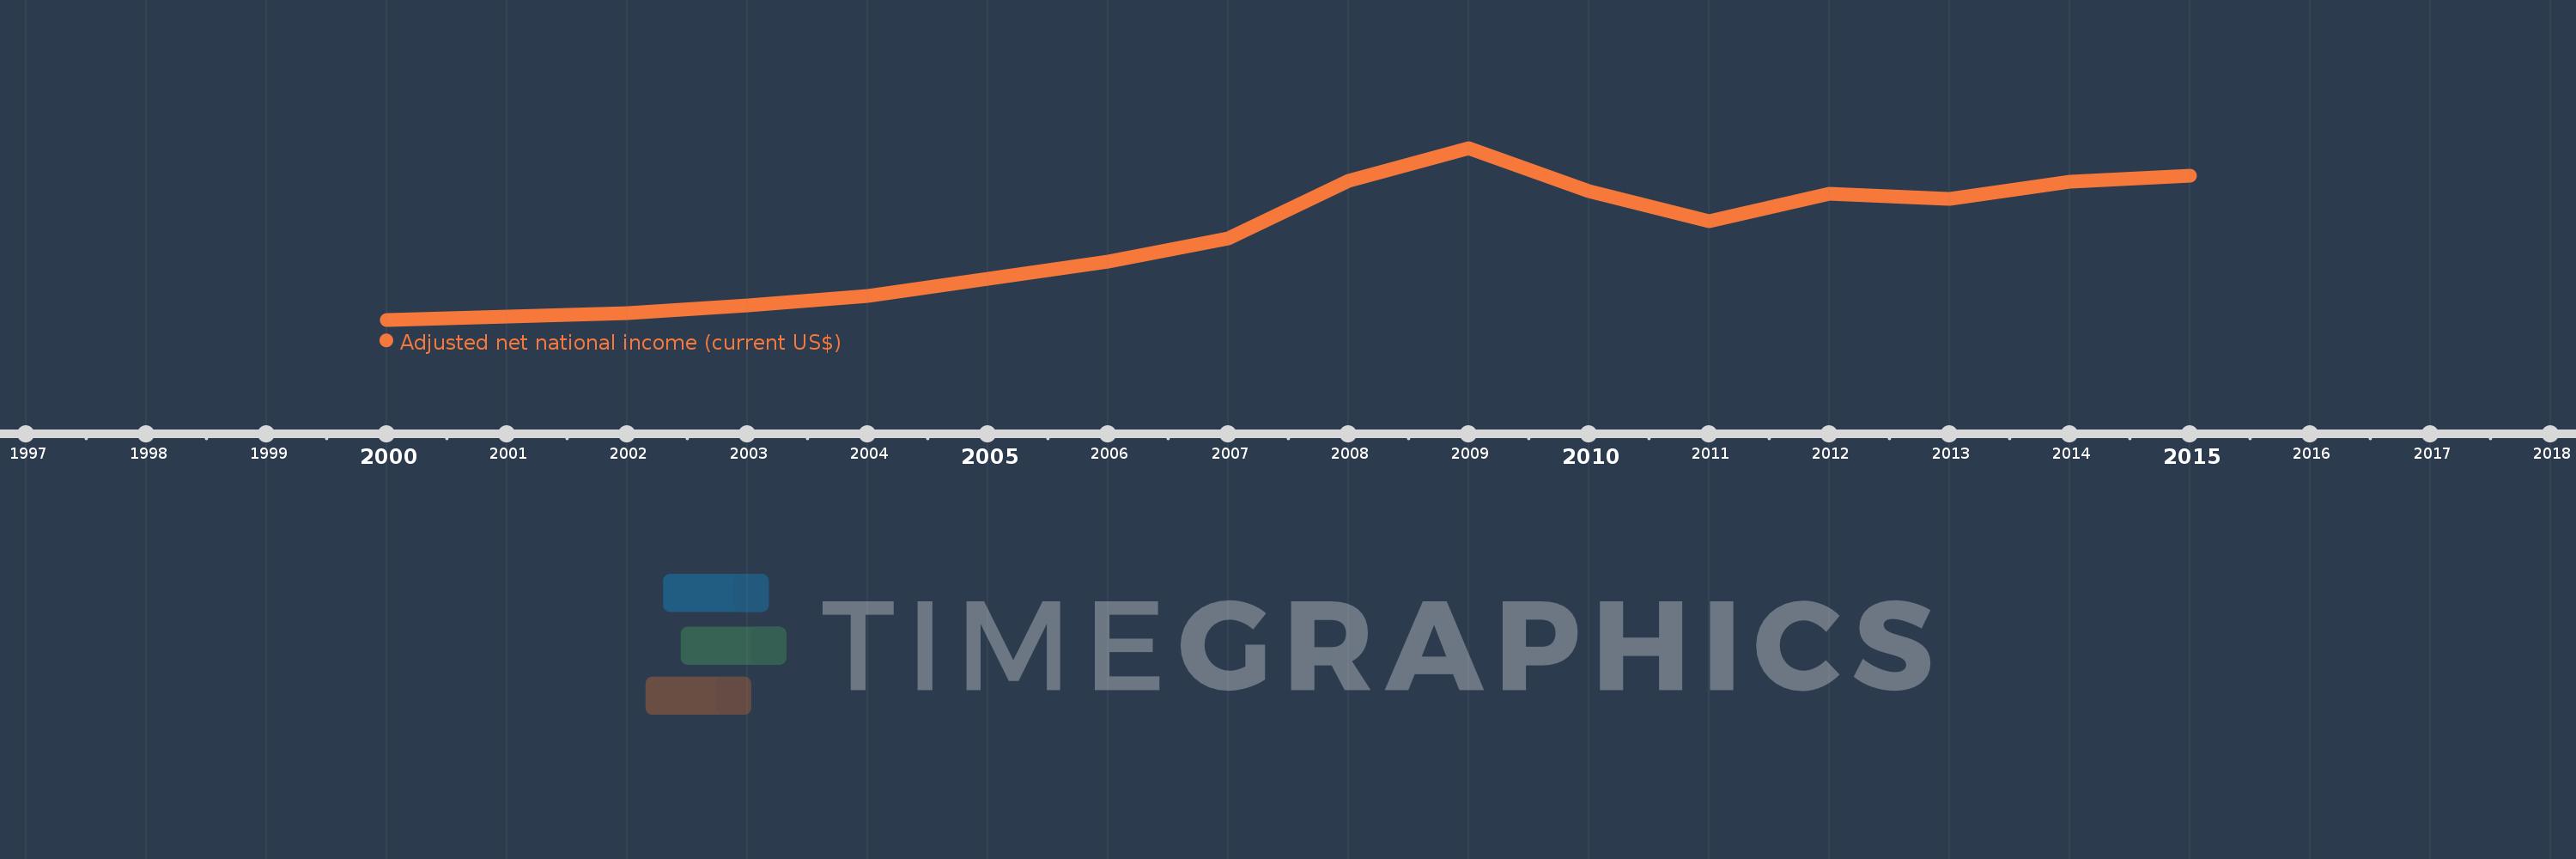
This timeline shows a graph from 2000 to 2015 of Latvia. No data until 1999. Number of actual observations by date: 16.
Source name:
World Development Indicators
Source organization:
World Bank staff estimates based on sources and methods in World Bank's "The Changing Wealth of Nations: Measuring Sustainable Development in the New Millennium" (2011).
Categories, topics:
Economy & Growth
Last updated:
apr 23, 2017
Indicators value changes by year
Meaning:
15.681 bln
Minimum:
5.745 bln
jan 1, 2000
Maximum:
26.829 bln
jan 1, 2009
At the date of observation
Value
Absolute change
Change from the previous value
jan 1, 2000
5.745 bln
+5.745 bln
0.0%
jan 1, 2001
6.163 bln
+418.361 mln
7.28%
jan 1, 2002
6.579 bln
+416.302 mln
6.75%
jan 1, 2003
7.522 bln
+942.629 mln
14.33%
jan 1, 2004
8.715 bln
+1.193 bln
15.86%
jan 1, 2005
10.759 bln
+2.044 bln
23.45%
jan 1, 2006
12.868 bln
+2.109 bln
19.6%
jan 1, 2007
15.75 bln
+2.882 bln
22.4%
jan 1, 2008
22.797 bln
+7.046 bln
44.74%
jan 1, 2009
26.829 bln
+4.032 bln
17.69%
jan 1, 2010
21.494 bln
-5.334 bln
-19.88%
jan 1, 2011
17.808 bln
-3.686 bln
-17.15%
jan 1, 2012
21.185 bln
+3.377 bln
18.96%
jan 1, 2013
20.627 bln
-557.647 mln
-2.63%
jan 1, 2014
22.646 bln
+2.018 bln
9.78%
jan 1, 2015
23.414 bln
+768.405 mln
3.39%
Ranking of countries by current statistics by years