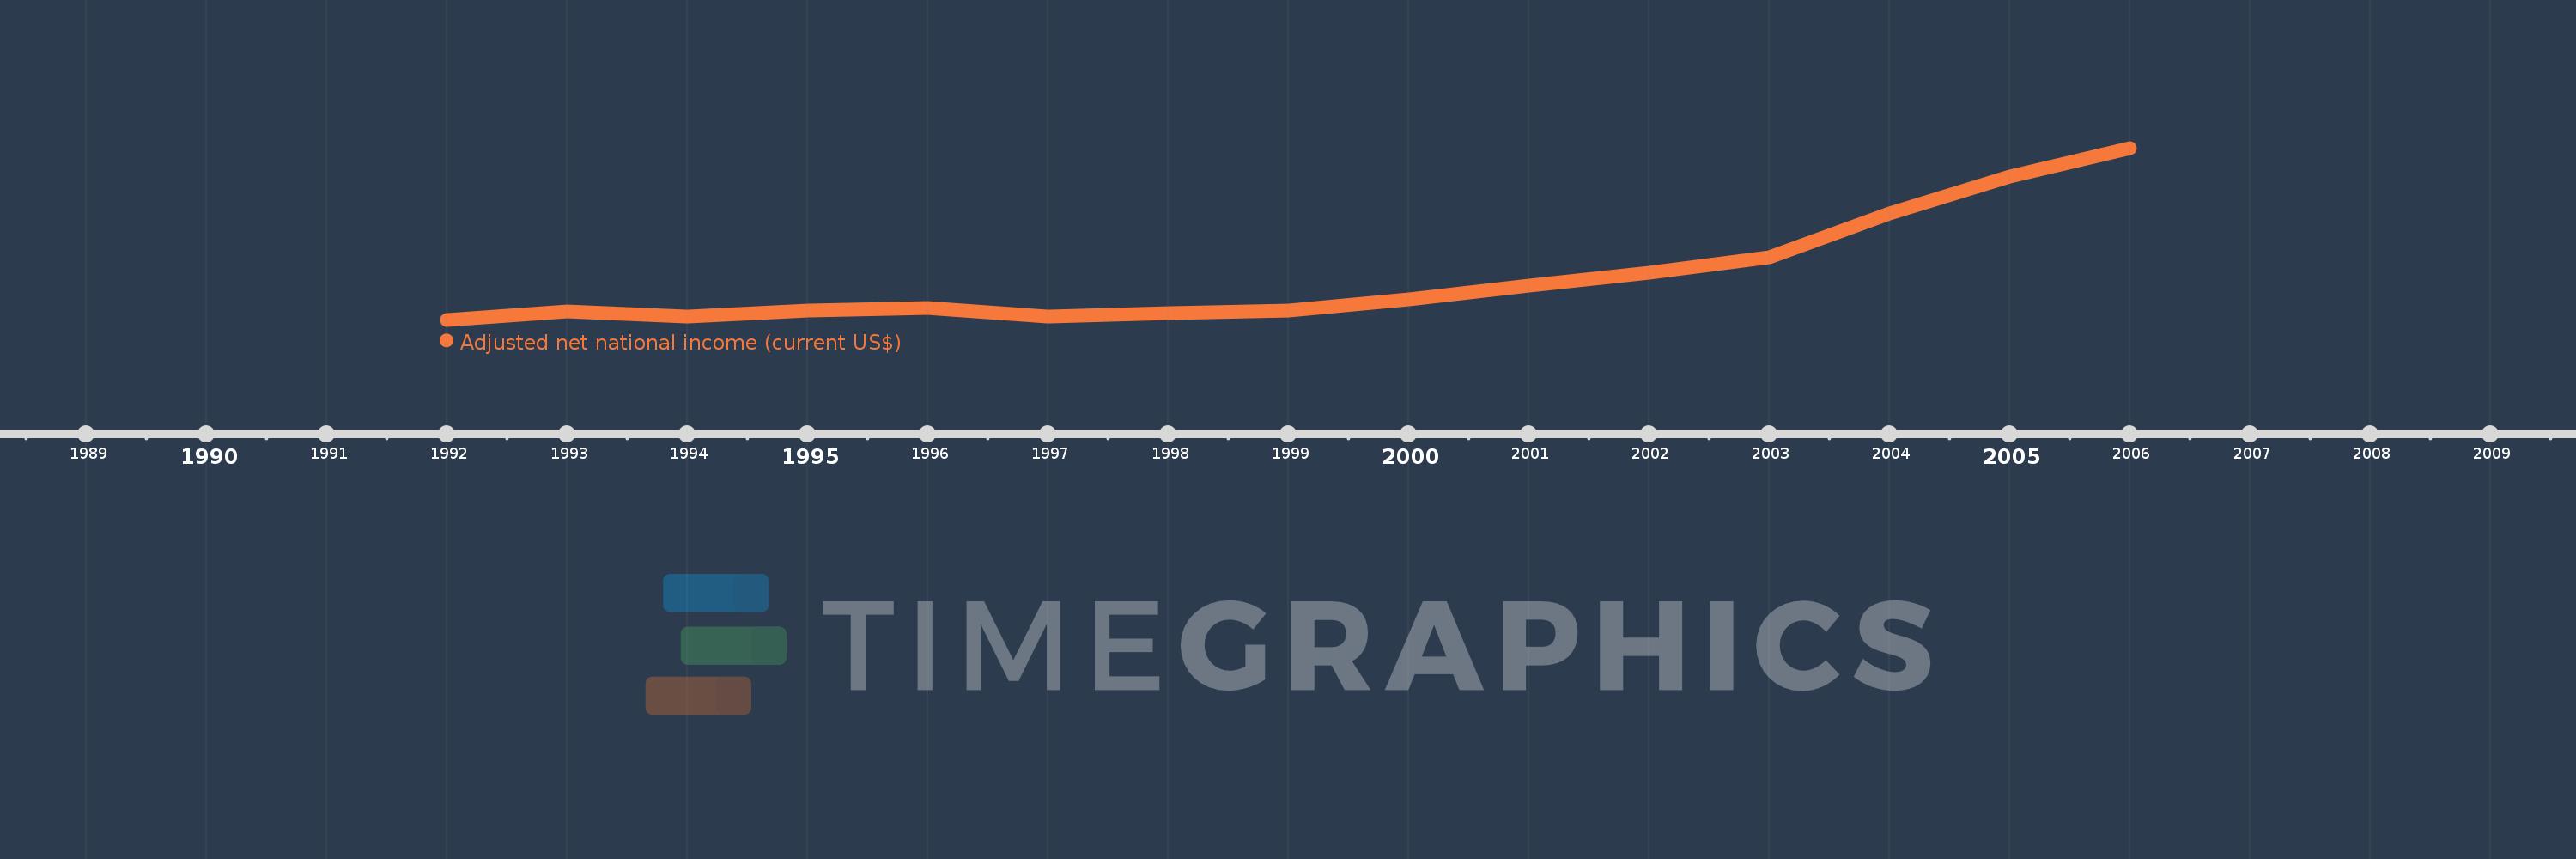
This timeline shows a graph from 1992 to 2006 of Djibouti. No data until 1991. Number of actual observations by date: 15.
Source name:
World Development Indicators
Source organization:
World Bank staff estimates based on sources and methods in World Bank's "The Changing Wealth of Nations: Measuring Sustainable Development in the New Millennium" (2011).
Categories, topics:
Economy & Growth
Last updated:
apr 23, 2017
Indicators value changes by year
Meaning:
505.999 mln
Minimum:
443.779 mln
jan 1, 1992
Maximum:
695.533 mln
jan 1, 2006
At the date of observation
Value
Absolute change
Change from the previous value
jan 1, 1992
443.779 mln
+443.779 mln
0.0%
jan 1, 1993
455.43 mln
+11.651 mln
2.63%
jan 1, 1994
448.214 mln
-7.216 mln
-1.58%
jan 1, 1995
457.572 mln
+9.358 mln
2.09%
jan 1, 1996
460.662 mln
+3.09 mln
0.68%
jan 1, 1997
449.044 mln
-11.618 mln
-2.52%
jan 1, 1998
453.954 mln
+4.909 mln
1.09%
jan 1, 1999
457.484 mln
+3.531 mln
0.78%
jan 1, 2000
473.13 mln
+15.646 mln
3.42%
jan 1, 2001
493.603 mln
+20.473 mln
4.33%
jan 1, 2002
512.466 mln
+18.863 mln
3.82%
jan 1, 2003
535.622 mln
+23.156 mln
4.52%
jan 1, 2004
599.304 mln
+63.682 mln
11.89%
jan 1, 2005
654.185 mln
+54.881 mln
9.16%
jan 1, 2006
695.533 mln
+41.349 mln
6.32%
Ranking of countries by current statistics by years