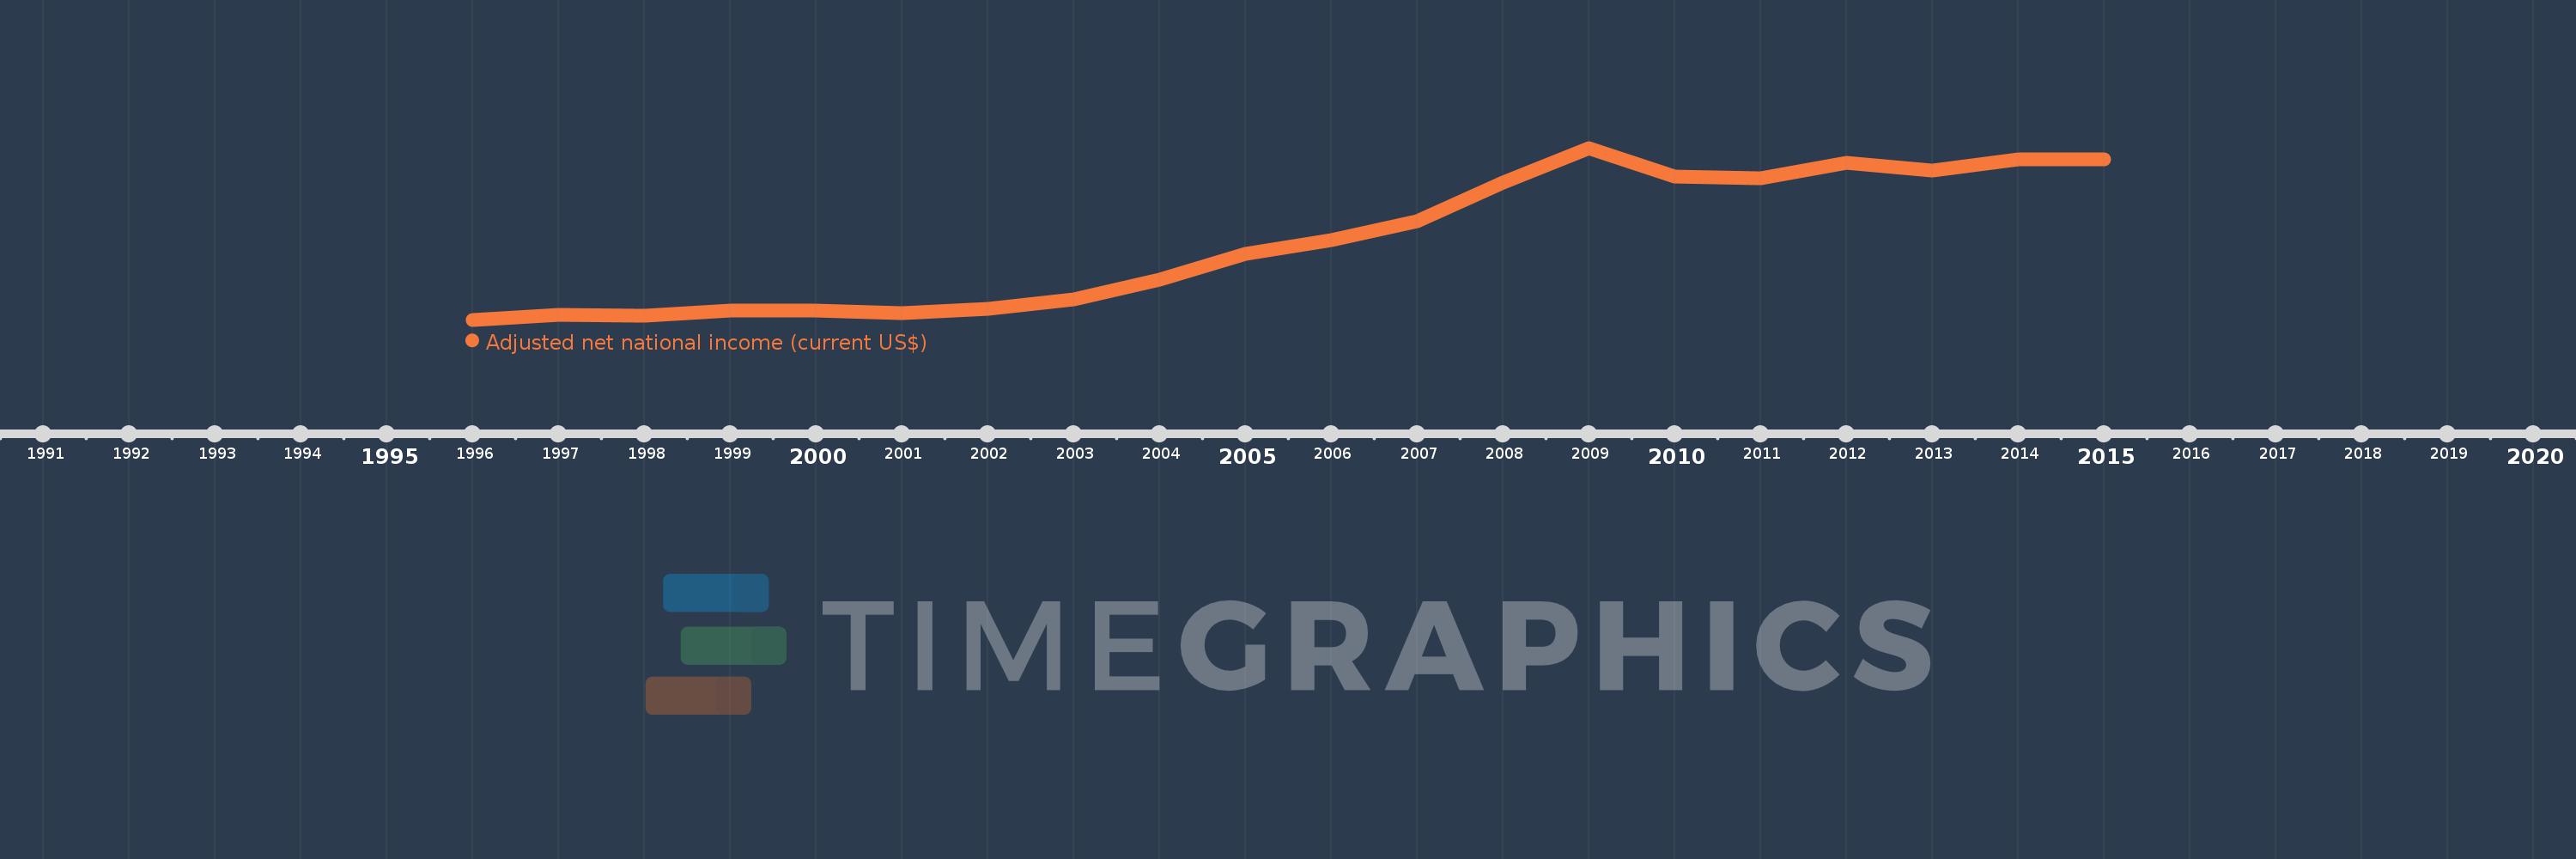
This timeline shows a graph from 1996 to 2015 of Slovak Republic. No data until 1995. Number of actual observations by date: 20.
Source name:
World Development Indicators
Source organization:
World Bank staff estimates based on sources and methods in World Bank's "The Changing Wealth of Nations: Measuring Sustainable Development in the New Millennium" (2011).
Categories, topics:
Economy & Growth
Last updated:
apr 23, 2017
Indicators value changes by year
Meaning:
47.173 bln
Minimum:
19.898 bln
jan 1, 1996
Maximum:
79.575 bln
jan 1, 2009
At the date of observation
Value
Absolute change
Change from the previous value
jan 1, 1996
19.898 bln
+19.898 bln
0.0%
jan 1, 1997
21.613 bln
+1.715 bln
8.62%
jan 1, 1998
21.365 bln
-247.785 mln
-1.15%
jan 1, 1999
23.101 bln
+1.736 bln
8.13%
jan 1, 2000
23.209 bln
+107.736 mln
0.47%
jan 1, 2001
22.24 bln
-968.758 mln
-4.17%
jan 1, 2002
23.7 bln
+1.459 bln
6.56%
jan 1, 2003
26.923 bln
+3.223 bln
13.6%
jan 1, 2004
33.878 bln
+6.955 bln
25.83%
jan 1, 2005
42.689 bln
+8.811 bln
26.01%
jan 1, 2006
47.516 bln
+4.827 bln
11.31%
jan 1, 2007
54.235 bln
+6.719 bln
14.14%
jan 1, 2008
67.487 bln
+13.252 bln
24.43%
jan 1, 2009
79.575 bln
+12.087 bln
17.91%
jan 1, 2010
69.774 bln
-9.8 bln
-12.32%
jan 1, 2011
69.002 bln
-771.961 mln
-1.11%
jan 1, 2012
74.272 bln
+5.269 bln
7.64%
jan 1, 2013
71.864 bln
-2.408 bln
-3.24%
jan 1, 2014
75.605 bln
+3.741 bln
5.21%
jan 1, 2015
75.509 bln
-96.171 mln
-0.13%
Ranking of countries by current statistics by years