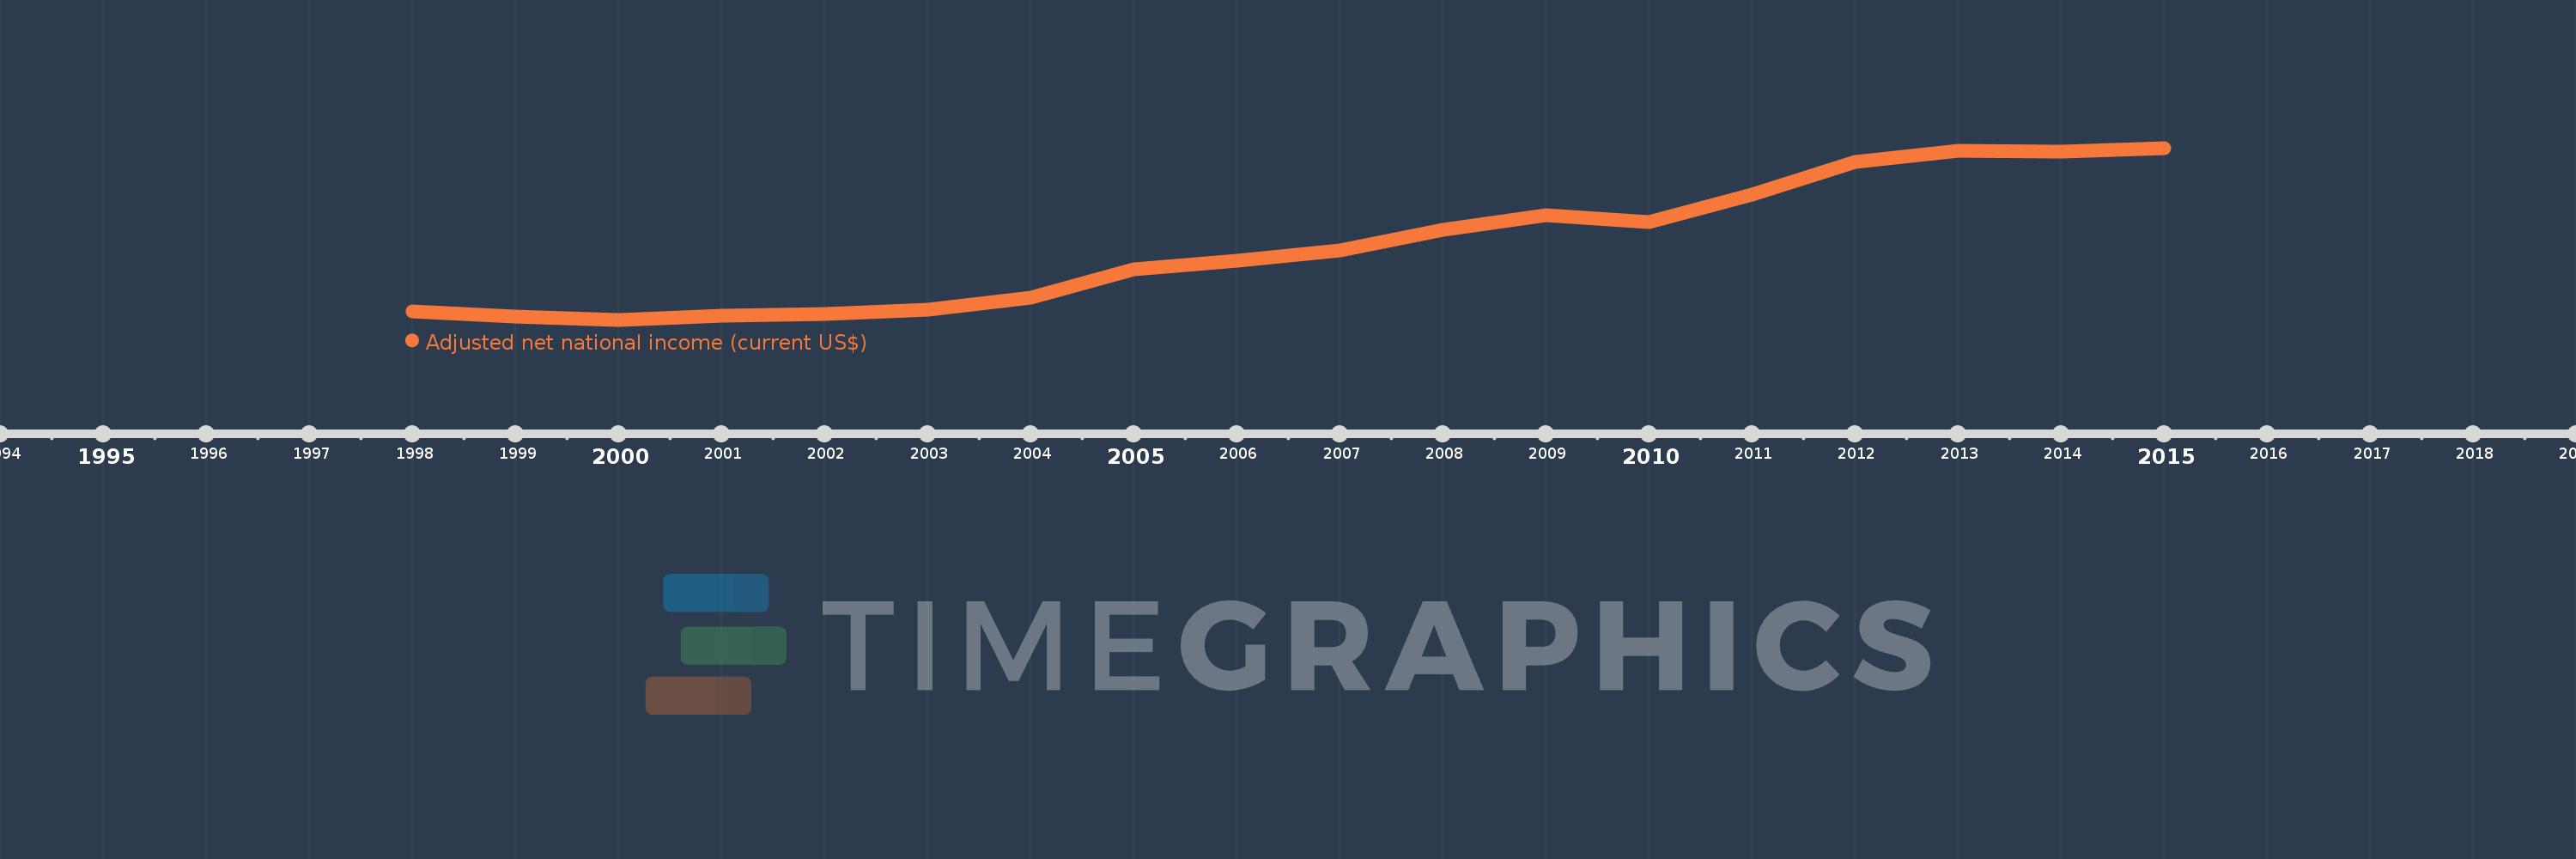
This timeline shows a graph from 1998 to 2015 of Samoa. No data until 1997. Number of actual observations by date: 18.
Source name:
World Development Indicators
Source organization:
World Bank staff estimates based on sources and methods in World Bank's "The Changing Wealth of Nations: Measuring Sustainable Development in the New Millennium" (2011).
Categories, topics:
Economy & Growth
Last updated:
apr 23, 2017
Indicators value changes by year
Meaning:
423.725 mln
Minimum:
228.367 mln
jan 1, 2000
Maximum:
687.356 mln
jan 1, 2015
At the date of observation
Value
Absolute change
Change from the previous value
jan 1, 1998
251.486 mln
+251.486 mln
0.0%
jan 1, 1999
237.591 mln
-13.895 mln
-5.53%
jan 1, 2000
228.367 mln
-9.224 mln
-3.88%
jan 1, 2001
239.408 mln
+11.041 mln
4.83%
jan 1, 2002
243.112 mln
+3.704 mln
1.55%
jan 1, 2003
255.451 mln
+12.339 mln
5.08%
jan 1, 2004
286.23 mln
+30.779 mln
12.05%
jan 1, 2005
363.91 mln
+77.68 mln
27.14%
jan 1, 2006
386.843 mln
+22.933 mln
6.3%
jan 1, 2007
413.03 mln
+26.187 mln
6.77%
jan 1, 2008
469.315 mln
+56.285 mln
13.63%
jan 1, 2009
507.303 mln
+37.987 mln
8.09%
jan 1, 2010
490.299 mln
-17.004 mln
-3.35%
jan 1, 2011
562.181 mln
+71.882 mln
14.66%
jan 1, 2012
649.284 mln
+87.103 mln
15.49%
jan 1, 2013
679.076 mln
+29.792 mln
4.59%
jan 1, 2014
676.813 mln
-2.264 mln
-0.33%
jan 1, 2015
687.356 mln
+10.543 mln
1.56%
Ranking of countries by current statistics by years