33
/
AIzaSyAYiBZKx7MnpbEhh9jyipgxe19OcubqV5w
August 1, 2025
158147
Iraq
IRQ
true
2
1
Adjusted net national income (current US$)
2015,2014,2013,2012,2011,2010,2009,2008,2007,2006,2005,1991,1990,1989,1988,1987,1986,1985,1984,1983,1982,1981
Download
Global statistics library →Iraq →

Adjusted net national income (current US$)

This statistics in other country:

AfghanistanAlbaniaAlgeriaAngolaArab WorldArgentinaArmeniaAustraliaAustriaAzerbaijanBahamas, TheBahrainBangladeshBarbadosBelarusBelgiumBelizeBeninBhutanBoliviaBotswanaBrazilBrunei DarussalamBulgariaBurkina FasoBurundiCabo VerdeCambodiaCameroonCanadaCaribbean small statesCentral African RepublicCentral Europe and the BalticsChadChileChinaColombiaComorosCongo, Dem. Rep.Congo, Rep.Costa RicaCote d'IvoireCroatiaCubaCyprusCzech RepublicDenmarkDjiboutiDominicaDominican RepublicEarly-demographic dividendEast Asia & PacificEast Asia & Pacific (excluding high income)East Asia & Pacific (IDA & IBRD countries)EcuadorEgypt, Arab Rep.El SalvadorEquatorial GuineaEritreaEstoniaEthiopiaEuro areaEurope & Central AsiaEurope & Central Asia (excluding high income)Europe & Central Asia (IDA & IBRD countries)European UnionFijiFinlandFragile and conflict affected situationsFranceGabonGambia, TheGeorgiaGermanyGhanaGreeceGuatemalaGuineaGuinea-BissauGuyanaHaitiHeavily indebted poor countries (HIPC)High incomeHondurasHong Kong SAR, ChinaHungaryIBRD onlyIcelandIDA & IBRD totalIDA blendIDA onlyIDA totalIndiaIndonesiaIran, Islamic Rep.IraqIrelandIsraelItalyJamaicaJapanJordanKazakhstanKenyaKiribatiKorea, Rep.KuwaitKyrgyz RepublicLao PDRLate-demographic dividendLatin America & Caribbean Latin America & Caribbean (excluding high income)Latin America & the Caribbean (IDA & IBRD countries)LatviaLeast developed countries: UN classificationLebanonLesothoLiberiaLibyaLithuaniaLow & middle incomeLow incomeLower middle incomeLuxembourgMacedonia, FYRMadagascarMalawiMalaysiaMaldivesMaliMauritaniaMauritiusMexicoMiddle East & North AfricaMiddle East & North Africa (excluding high income)Middle East & North Africa (IDA & IBRD countries)Middle incomeMoldovaMongoliaMoroccoMozambiqueMyanmarNamibiaNepalNetherlandsNew ZealandNicaraguaNigerNigeriaNorth AmericaNorwayOECD membersOmanOther small statesPacific island small statesPakistanPanamaPapua New GuineaParaguayPeruPhilippinesPolandPortugalPost-demographic dividendPre-demographic dividendQatarRomaniaRussian FederationRwandaSamoaSao Tome and PrincipeSaudi ArabiaSenegalSeychellesSierra LeoneSingaporeSlovak RepublicSloveniaSmall statesSolomon IslandsSouth AfricaSouth AsiaSouth Asia (IDA & IBRD)SpainSri LankaSt. LuciaSt. Vincent and the GrenadinesSub-Saharan Africa Sub-Saharan Africa (excluding high income)Sub-Saharan Africa (IDA & IBRD countries)SudanSurinameSwazilandSwedenSwitzerlandSyrian Arab RepublicTajikistanTanzaniaThailandTogoTongaTrinidad and TobagoTunisiaTurkeyTurkmenistanUgandaUkraineUnited Arab EmiratesUnited KingdomUnited StatesUpper middle incomeUruguayUzbekistanVanuatuVenezuela, RBVietnamWorldYemen, Rep.ZambiaZimbabwe

Timeline:

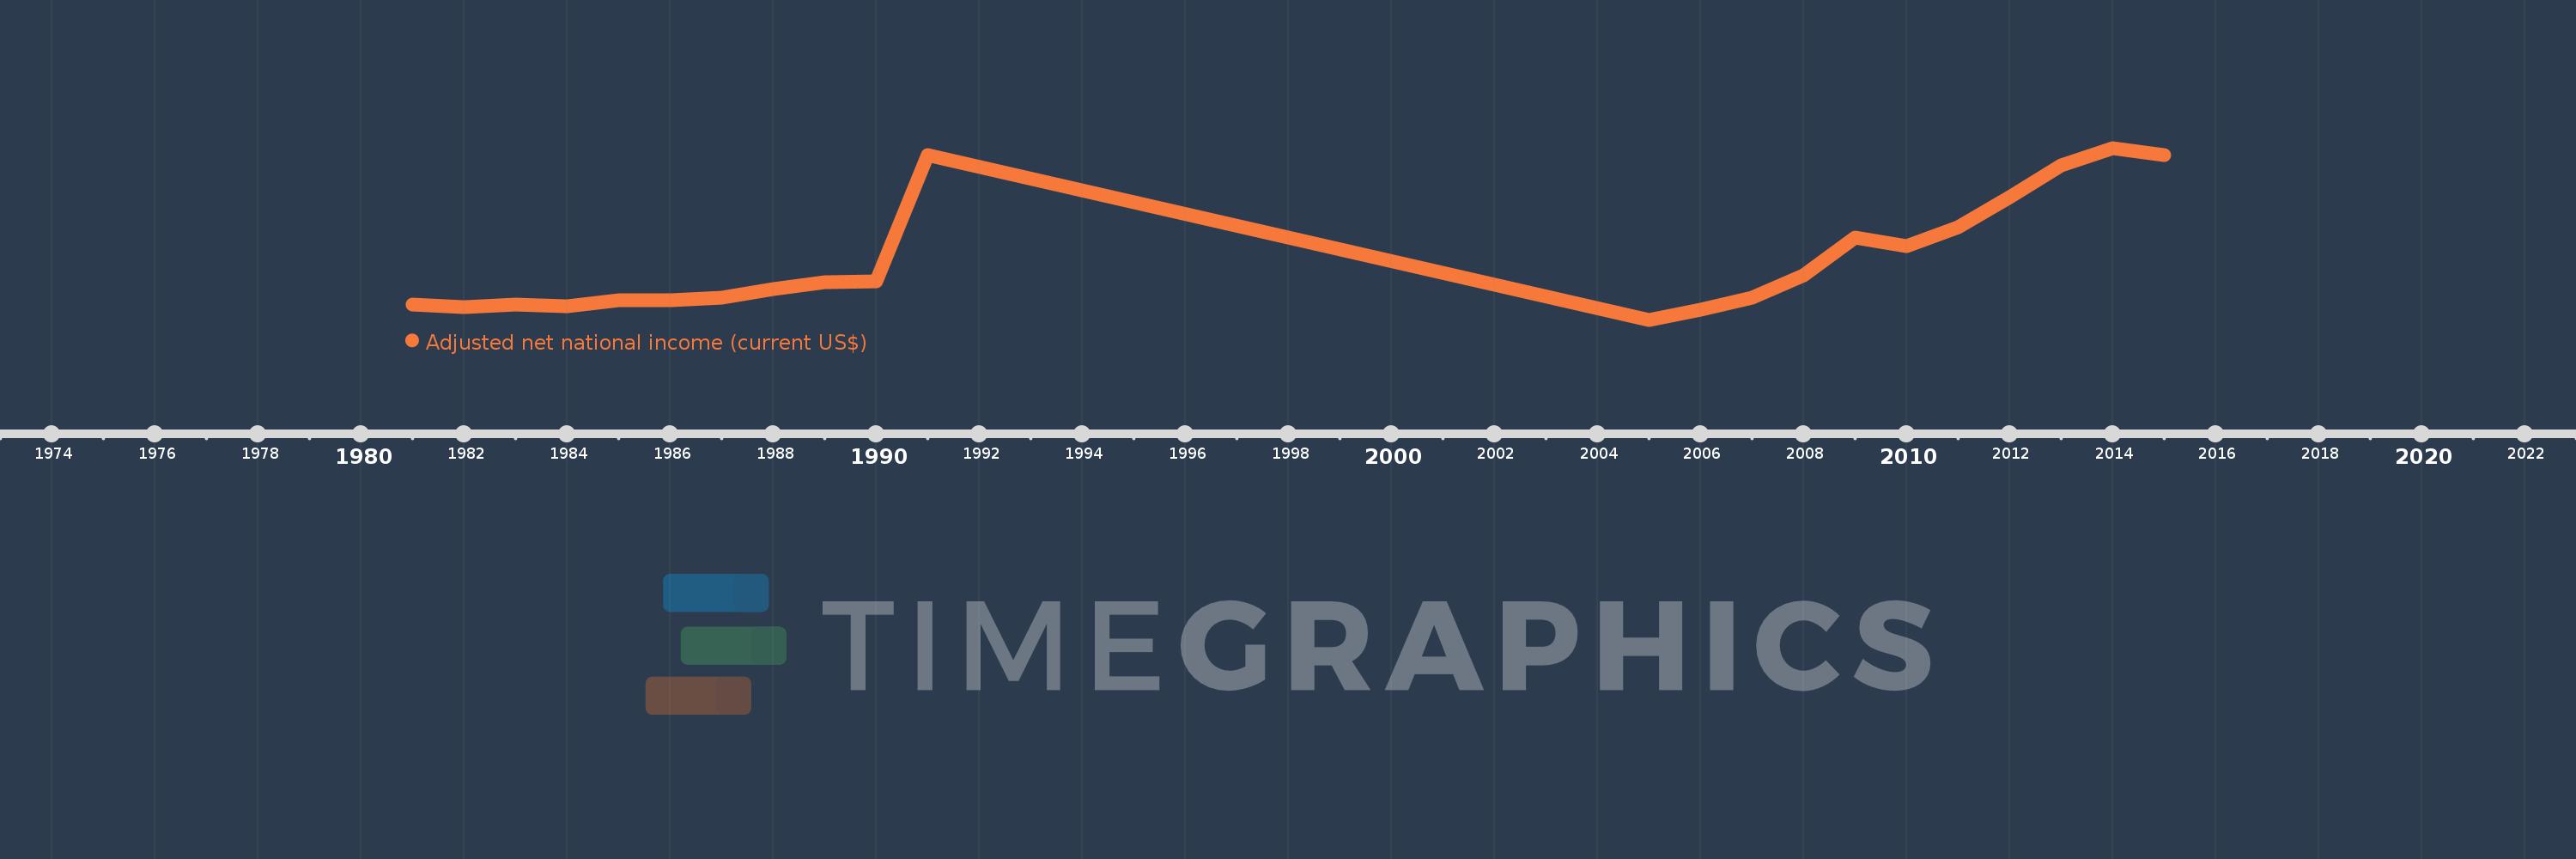
This timeline shows a graph from 1981 to 2015 of Iraq. No data until 1980. Number of actual observations by date: 22.

Source name:

World Development Indicators

Source organization:

World Bank staff estimates based on sources and methods in World Bank's "The Changing Wealth of Nations: Measuring Sustainable Development in the New Millennium" (2011).

Categories, topics:

Economy & Growth

Last updated:

apr 23, 2017

Indicators value changes by year

Meaning:
69.082 bln
Minimum:
19.18 bln
jan 1, 2005
Maximum:
161.344 bln
jan 1, 2014
At the date of observation
Value
Absolute change
Change from the previous value
jan 1, 1981
31.55 bln
+31.55 bln
0.0%
jan 1, 1982
29.513 bln
-2.036 bln
-6.45%
jan 1, 1983
31.869 bln
+2.356 bln
7.98%
jan 1, 1984
30.305 bln
-1.563 bln
-4.91%
jan 1, 1985
35.553 bln
+5.248 bln
17.32%
jan 1, 1986
35.515 bln
-38.404 mln
-0.11%
jan 1, 1987
37.323 bln
+1.808 bln
5.09%
jan 1, 1988
44.554 bln
+7.231 bln
19.38%
jan 1, 1989
50.116 bln
+5.562 bln
12.48%
jan 1, 1990
51.041 bln
+924.461 mln
1.84%
jan 1, 1991
155.219 bln
+104.178 bln
204.11%
jan 1, 2005
19.18 bln
-136.039 bln
-87.64%
jan 1, 2006
27.259 bln
+8.079 bln
42.12%
jan 1, 2007
37.686 bln
+10.427 bln
38.25%
jan 1, 2008
56.128 bln
+18.442 bln
48.94%
jan 1, 2009
87.276 bln
+31.148 bln
55.49%
jan 1, 2010
80.388 bln
-6.888 bln
-7.89%
jan 1, 2011
95.609 bln
+15.22 bln
18.93%
jan 1, 2012
120.293 bln
+24.685 bln
25.82%
jan 1, 2013
146.662 bln
+26.369 bln
21.92%
jan 1, 2014
161.344 bln
+14.682 bln
10.01%
jan 1, 2015
155.43 bln
-5.915 bln
-3.67%

Ranking of countries by current statistics by years