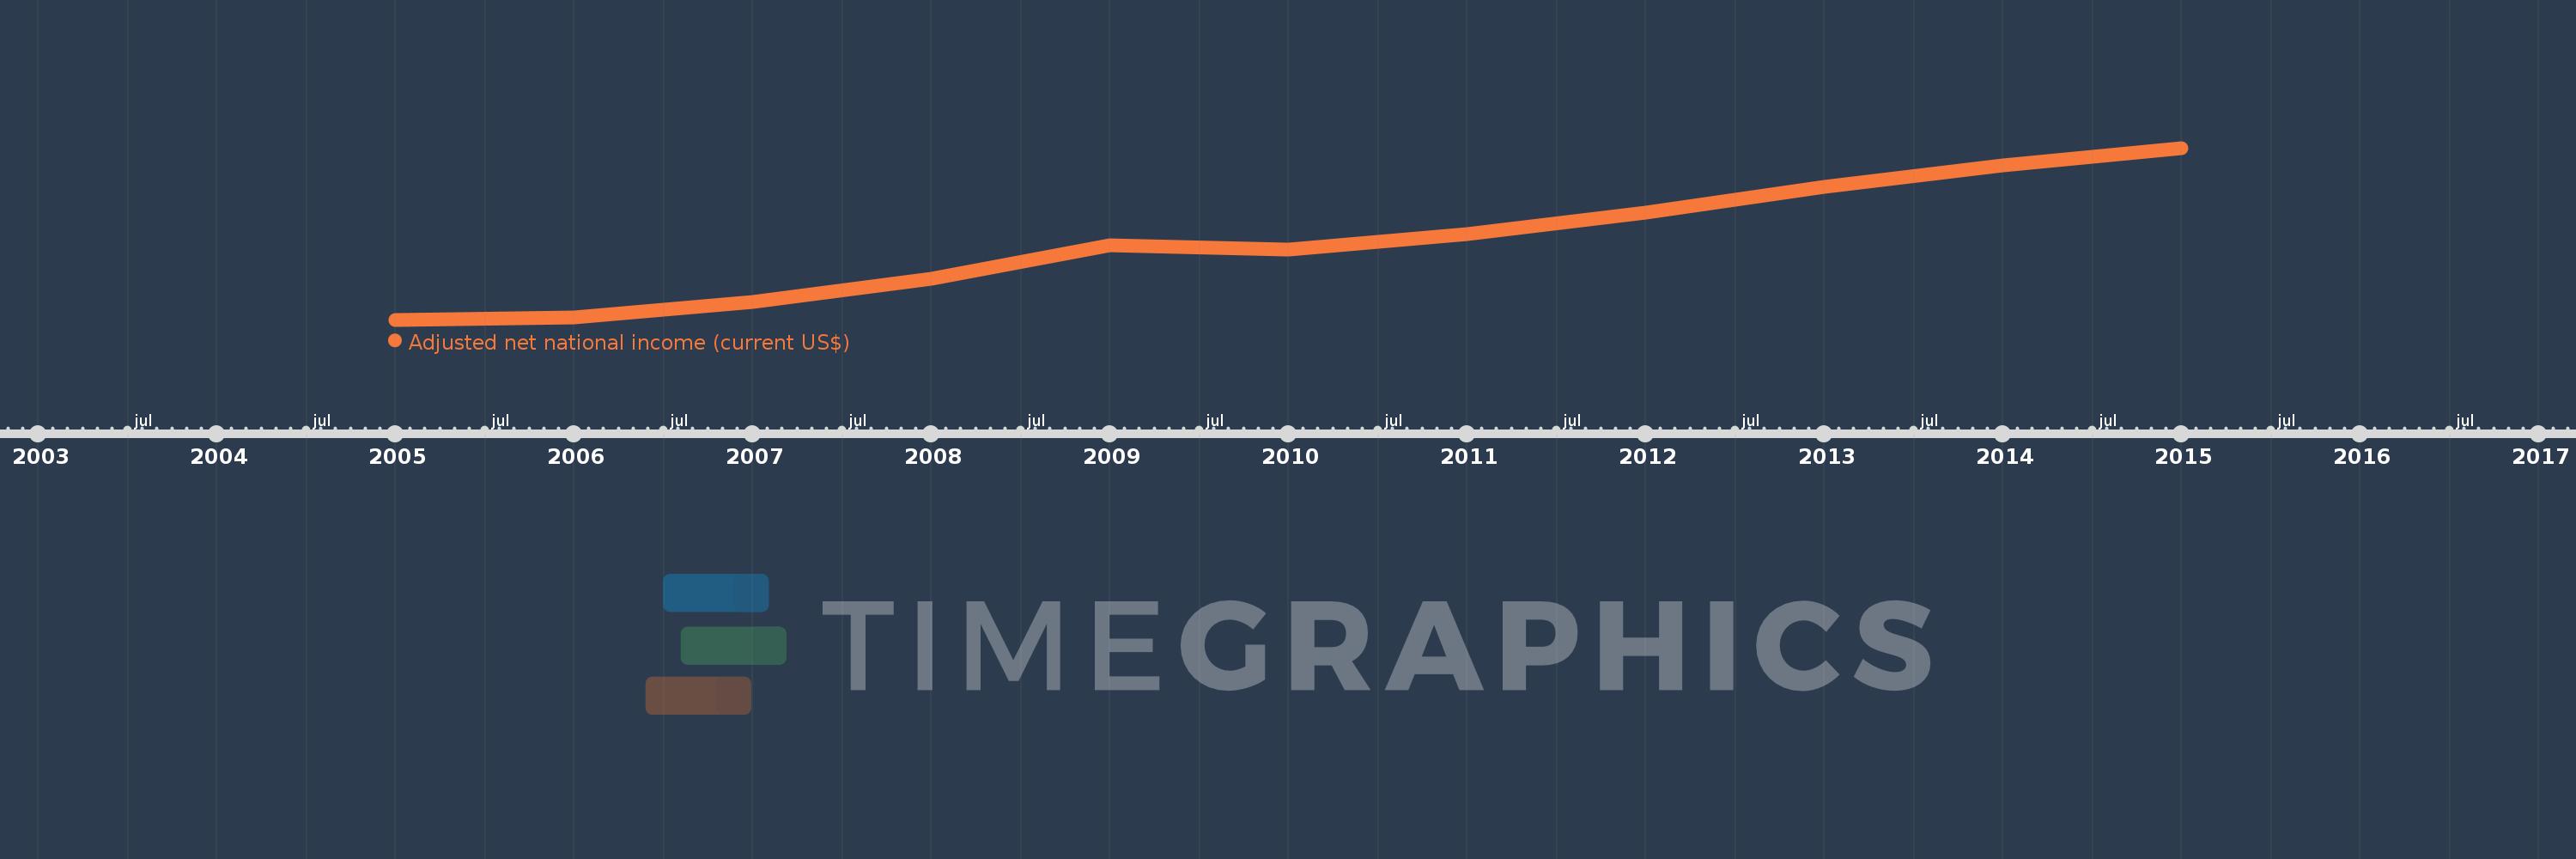
This timeline shows a graph from 2005 to 2015 of Tajikistan. No data until 2004. Number of actual observations by date: 11.
Source name:
World Development Indicators
Source organization:
World Bank staff estimates based on sources and methods in World Bank's "The Changing Wealth of Nations: Measuring Sustainable Development in the New Millennium" (2011).
Categories, topics:
Economy & Growth
Last updated:
apr 23, 2017
Indicators value changes by year
Meaning:
4.819 bln
Minimum:
1.614 bln
jan 1, 2005
Maximum:
8.678 bln
jan 1, 2015
At the date of observation
Value
Absolute change
Change from the previous value
jan 1, 2005
1.614 bln
+1.614 bln
0.0%
jan 1, 2006
1.716 bln
+101.402 mln
6.28%
jan 1, 2007
2.347 bln
+630.966 mln
36.78%
jan 1, 2008
3.288 bln
+941.617 mln
40.13%
jan 1, 2009
4.668 bln
+1.38 bln
41.97%
jan 1, 2010
4.512 bln
-156.799 mln
-3.36%
jan 1, 2011
5.131 bln
+619.131 mln
13.72%
jan 1, 2012
6.011 bln
+879.829 mln
17.15%
jan 1, 2013
7.079 bln
+1.069 bln
17.78%
jan 1, 2014
7.965 bln
+885.773 mln
12.51%
jan 1, 2015
8.678 bln
+713.555 mln
8.96%
Ranking of countries by current statistics by years