33
/
AIzaSyAYiBZKx7MnpbEhh9jyipgxe19OcubqV5w
August 1, 2025
242271
Slovenia
SVN
true
2
1
Adjusted net national income (current US$)
2015,2014,2013,2012,2011,2010,2009,2008,2007,2006,2005,2004,2003,2002,2001,2000,1999,1998,1997,1996
Download
Global statistics library →Slovenia →

Adjusted net national income (current US$)

This statistics in other country:

AfghanistanAlbaniaAlgeriaAngolaArab WorldArgentinaArmeniaAustraliaAustriaAzerbaijanBahamas, TheBahrainBangladeshBarbadosBelarusBelgiumBelizeBeninBhutanBoliviaBotswanaBrazilBrunei DarussalamBulgariaBurkina FasoBurundiCabo VerdeCambodiaCameroonCanadaCaribbean small statesCentral African RepublicCentral Europe and the BalticsChadChileChinaColombiaComorosCongo, Dem. Rep.Congo, Rep.Costa RicaCote d'IvoireCroatiaCubaCyprusCzech RepublicDenmarkDjiboutiDominicaDominican RepublicEarly-demographic dividendEast Asia & PacificEast Asia & Pacific (excluding high income)East Asia & Pacific (IDA & IBRD countries)EcuadorEgypt, Arab Rep.El SalvadorEquatorial GuineaEritreaEstoniaEthiopiaEuro areaEurope & Central AsiaEurope & Central Asia (excluding high income)Europe & Central Asia (IDA & IBRD countries)European UnionFijiFinlandFragile and conflict affected situationsFranceGabonGambia, TheGeorgiaGermanyGhanaGreeceGuatemalaGuineaGuinea-BissauGuyanaHaitiHeavily indebted poor countries (HIPC)High incomeHondurasHong Kong SAR, ChinaHungaryIBRD onlyIcelandIDA & IBRD totalIDA blendIDA onlyIDA totalIndiaIndonesiaIran, Islamic Rep.IraqIrelandIsraelItalyJamaicaJapanJordanKazakhstanKenyaKiribatiKorea, Rep.KuwaitKyrgyz RepublicLao PDRLate-demographic dividendLatin America & Caribbean Latin America & Caribbean (excluding high income)Latin America & the Caribbean (IDA & IBRD countries)LatviaLeast developed countries: UN classificationLebanonLesothoLiberiaLibyaLithuaniaLow & middle incomeLow incomeLower middle incomeLuxembourgMacedonia, FYRMadagascarMalawiMalaysiaMaldivesMaliMauritaniaMauritiusMexicoMiddle East & North AfricaMiddle East & North Africa (excluding high income)Middle East & North Africa (IDA & IBRD countries)Middle incomeMoldovaMongoliaMoroccoMozambiqueMyanmarNamibiaNepalNetherlandsNew ZealandNicaraguaNigerNigeriaNorth AmericaNorwayOECD membersOmanOther small statesPacific island small statesPakistanPanamaPapua New GuineaParaguayPeruPhilippinesPolandPortugalPost-demographic dividendPre-demographic dividendQatarRomaniaRussian FederationRwandaSamoaSao Tome and PrincipeSaudi ArabiaSenegalSeychellesSierra LeoneSingaporeSlovak RepublicSloveniaSmall statesSolomon IslandsSouth AfricaSouth AsiaSouth Asia (IDA & IBRD)SpainSri LankaSt. LuciaSt. Vincent and the GrenadinesSub-Saharan Africa Sub-Saharan Africa (excluding high income)Sub-Saharan Africa (IDA & IBRD countries)SudanSurinameSwazilandSwedenSwitzerlandSyrian Arab RepublicTajikistanTanzaniaThailandTogoTongaTrinidad and TobagoTunisiaTurkeyTurkmenistanUgandaUkraineUnited Arab EmiratesUnited KingdomUnited StatesUpper middle incomeUruguayUzbekistanVanuatuVenezuela, RBVietnamWorldYemen, Rep.ZambiaZimbabwe

Timeline:

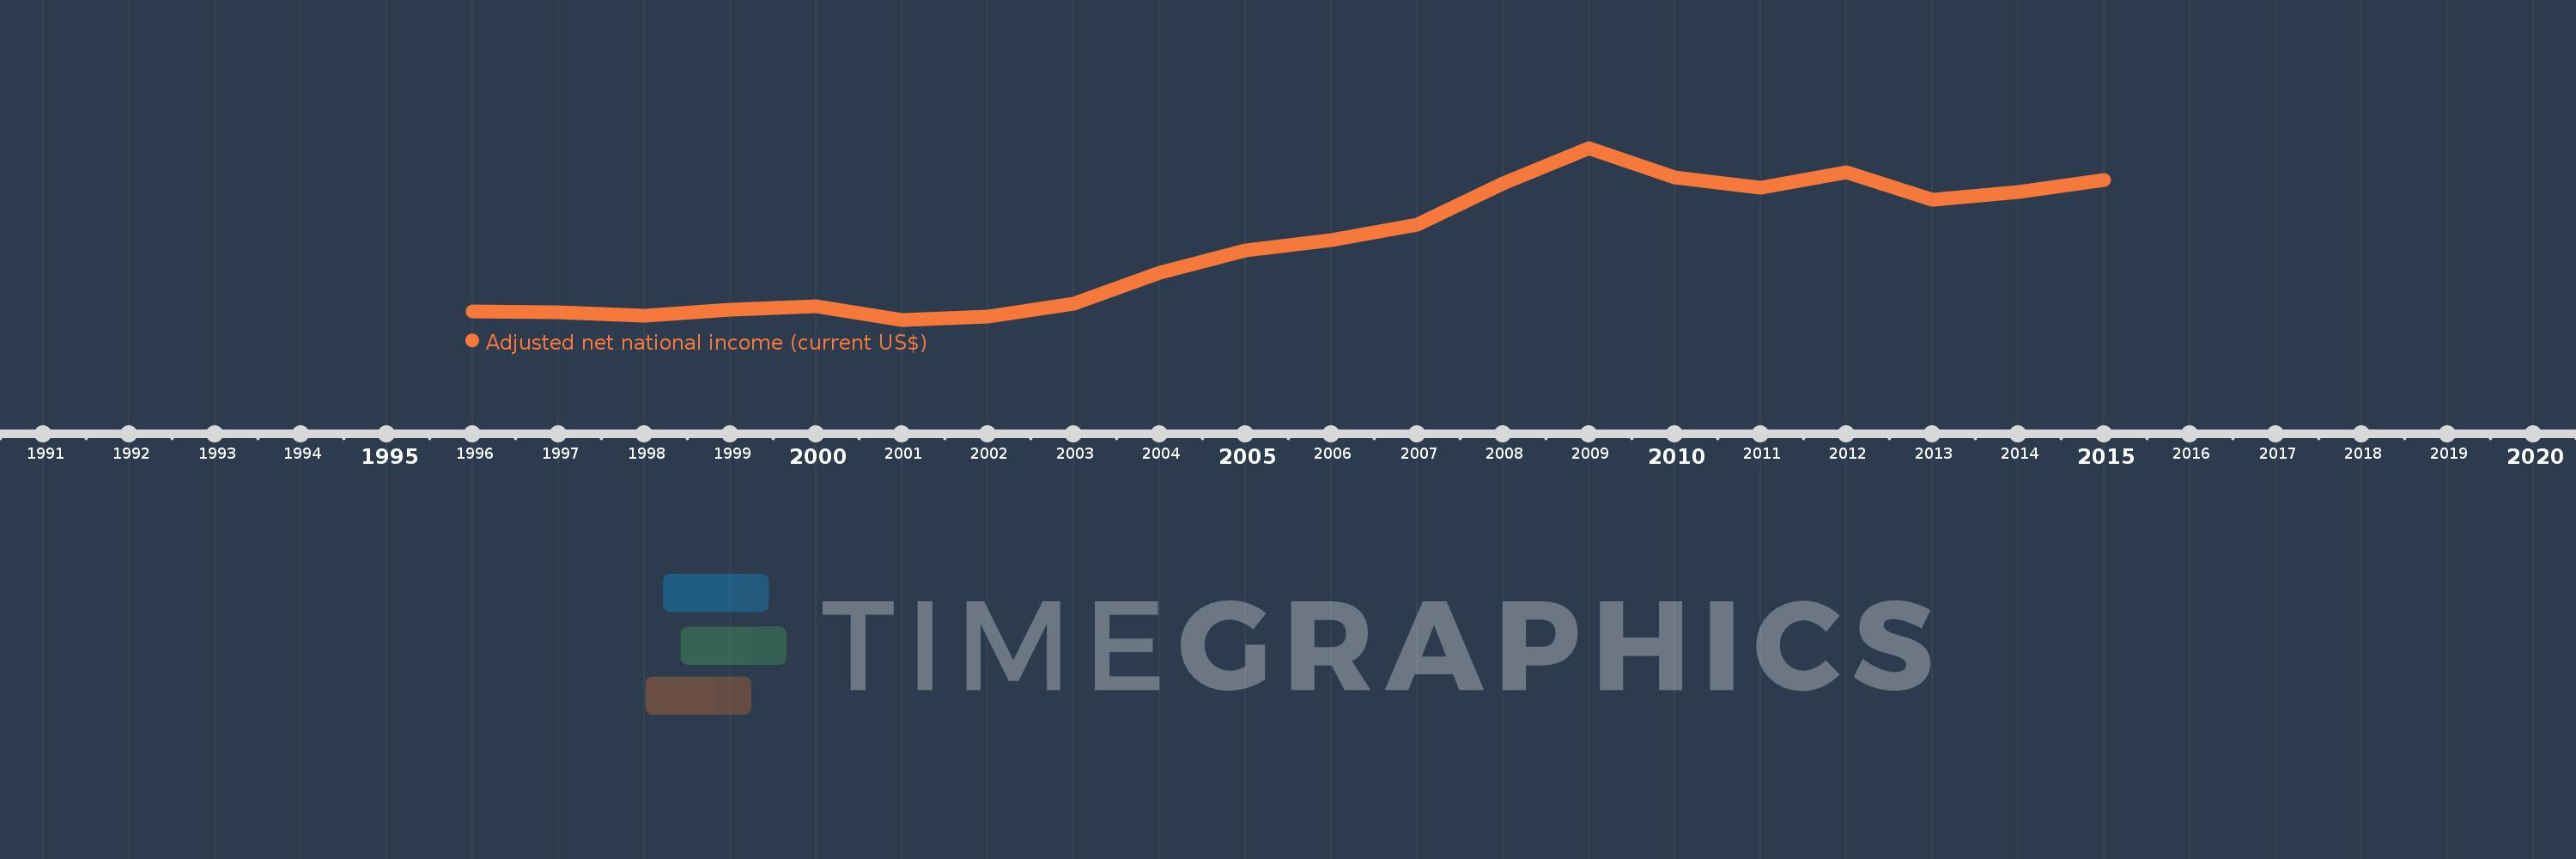
This timeline shows a graph from 1996 to 2015 of Slovenia. No data until 1995. Number of actual observations by date: 20.

Source name:

World Development Indicators

Source organization:

World Bank staff estimates based on sources and methods in World Bank's "The Changing Wealth of Nations: Measuring Sustainable Development in the New Millennium" (2011).

Categories, topics:

Economy & Growth

Last updated:

apr 23, 2017

Indicators value changes by year

Meaning:
28.358 bln
Minimum:
16.364 bln
jan 1, 2001
Maximum:
44.36 bln
jan 1, 2009
At the date of observation
Value
Absolute change
Change from the previous value
jan 1, 1996
17.679 bln
+17.679 bln
0.0%
jan 1, 1997
17.63 bln
-48.853 mln
-0.28%
jan 1, 1998
16.983 bln
-647.165 mln
-3.67%
jan 1, 1999
18.028 bln
+1.046 bln
6.16%
jan 1, 2000
18.617 bln
+588.774 mln
3.27%
jan 1, 2001
16.364 bln
-2.253 bln
-12.1%
jan 1, 2002
16.887 bln
+523.805 mln
3.2%
jan 1, 2003
19.022 bln
+2.134 bln
12.64%
jan 1, 2004
23.967 bln
+4.945 bln
26.0%
jan 1, 2005
27.669 bln
+3.702 bln
15.45%
jan 1, 2006
29.31 bln
+1.642 bln
5.93%
jan 1, 2007
31.912 bln
+2.602 bln
8.88%
jan 1, 2008
38.595 bln
+6.683 bln
20.94%
jan 1, 2009
44.36 bln
+5.765 bln
14.94%
jan 1, 2010
39.628 bln
-4.733 bln
-10.67%
jan 1, 2011
37.869 bln
-1.759 bln
-4.44%
jan 1, 2012
40.418 bln
+2.549 bln
6.73%
jan 1, 2013
35.975 bln
-4.443 bln
-10.99%
jan 1, 2014
37.183 bln
+1.209 bln
3.36%
jan 1, 2015
39.072 bln
+1.889 bln
5.08%

Ranking of countries by current statistics by years