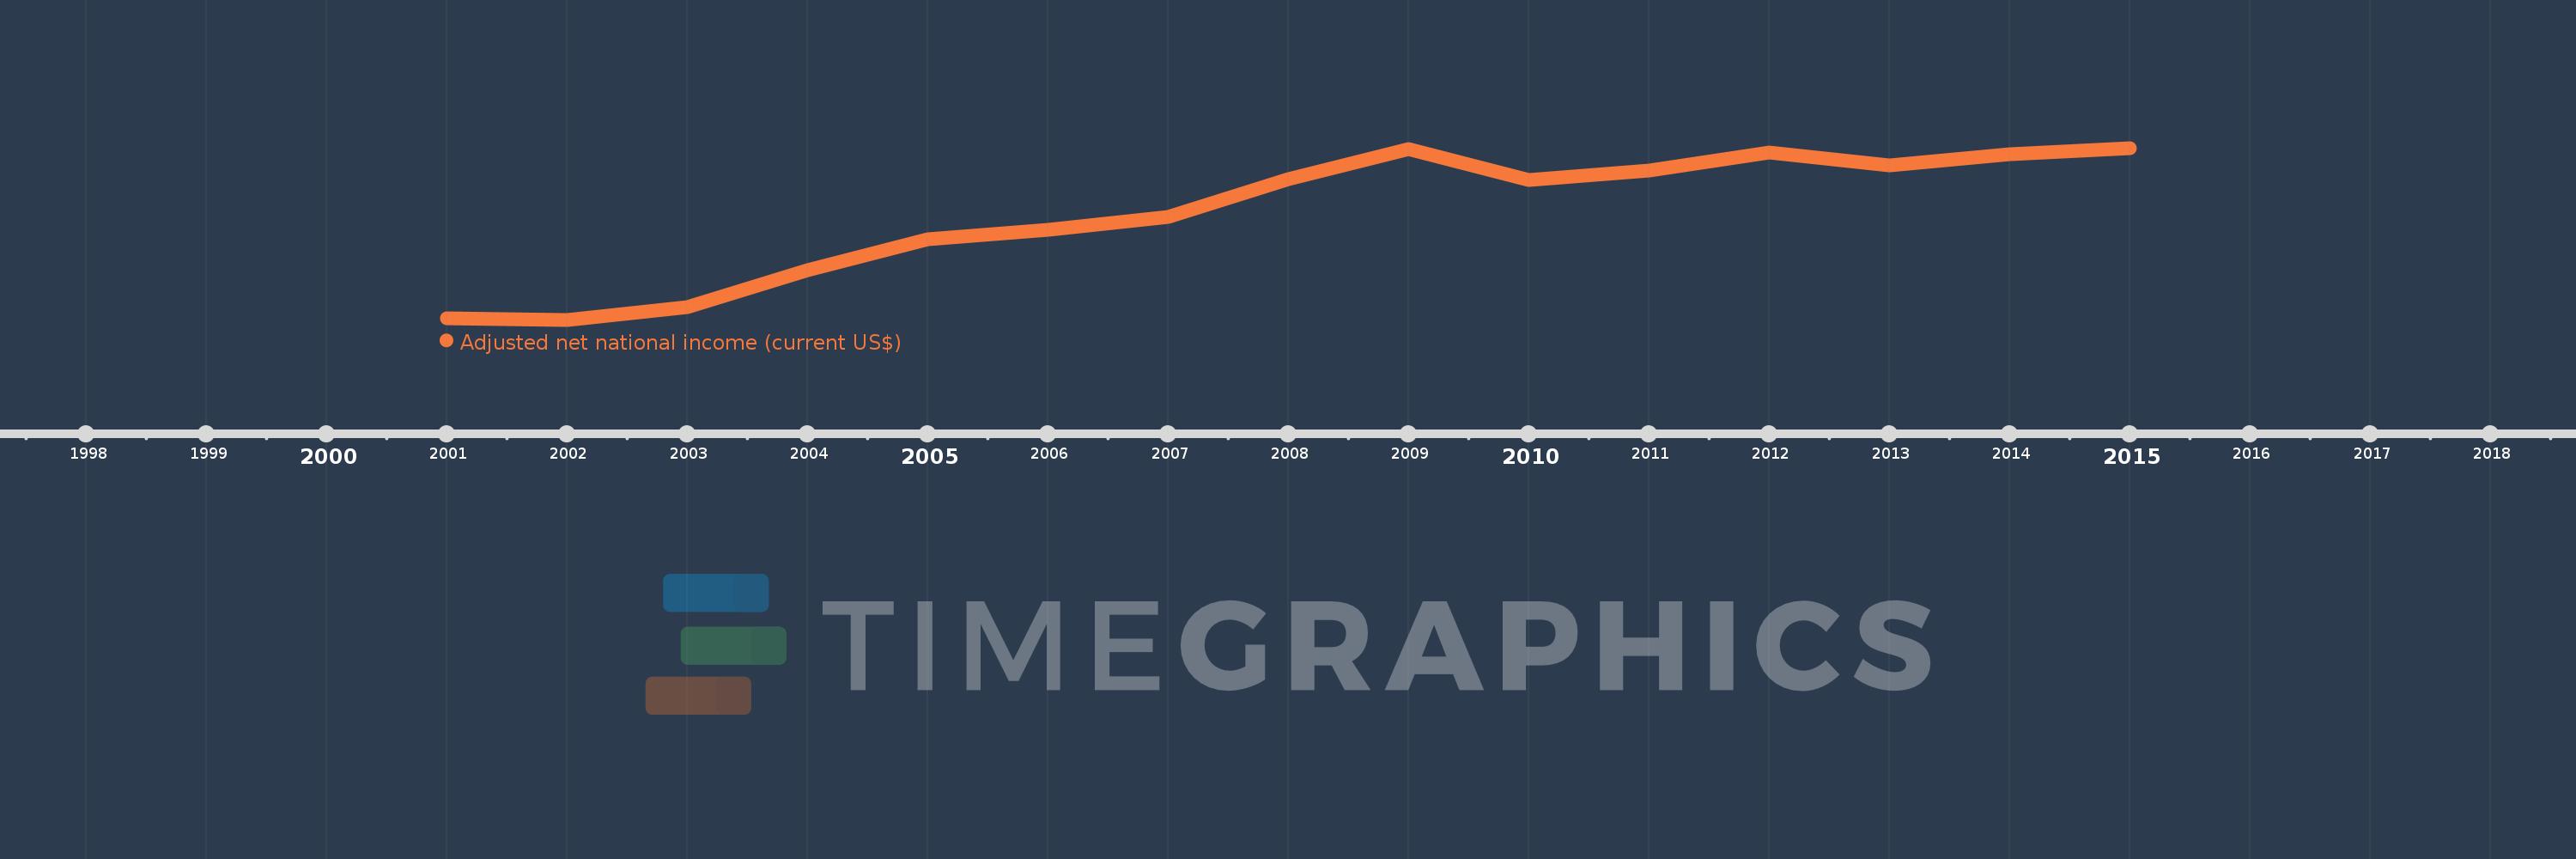
This timeline shows a graph from 2001 to 2015 of Belgium. No data until 2000. Number of actual observations by date: 15.
Source name:
World Development Indicators
Source organization:
World Bank staff estimates based on sources and methods in World Bank's "The Changing Wealth of Nations: Measuring Sustainable Development in the New Millennium" (2011).
Categories, topics:
Economy & Growth
Last updated:
apr 23, 2017
Indicators value changes by year
Meaning:
346.305 bln
Minimum:
201.652 bln
jan 1, 2002
Maximum:
434.927 bln
jan 1, 2015
At the date of observation
Value
Absolute change
Change from the previous value
jan 1, 2001
204.096 bln
+204.096 bln
0.0%
jan 1, 2002
201.652 bln
-2.444 bln
-1.2%
jan 1, 2003
219.011 bln
+17.359 bln
8.61%
jan 1, 2004
268.893 bln
+49.883 bln
22.78%
jan 1, 2005
311.478 bln
+42.585 bln
15.84%
jan 1, 2006
323.756 bln
+12.278 bln
3.94%
jan 1, 2007
341.718 bln
+17.962 bln
5.55%
jan 1, 2008
393.106 bln
+51.388 bln
15.04%
jan 1, 2009
433.782 bln
+40.676 bln
10.35%
jan 1, 2010
391.154 bln
-42.628 bln
-9.83%
jan 1, 2011
404.789 bln
+13.635 bln
3.49%
jan 1, 2012
429.135 bln
+24.345 bln
6.01%
jan 1, 2013
411.04 bln
-18.094 bln
-4.22%
jan 1, 2014
426.042 bln
+15.002 bln
3.65%
jan 1, 2015
434.927 bln
+8.885 bln
2.09%
Ranking of countries by current statistics by years