33
/
AIzaSyAYiBZKx7MnpbEhh9jyipgxe19OcubqV5w
May 1, 2025
117575
Czech Republic
CZE
true
2
1
Adjusted net national income (current US$)
2015,2014,2013,2012,2011,2010,2009,2008,2007,2006,2005,2004,2003,2002,2001,2000,1999,1998,1997,1996,1995,1994
Download
Global statistics library →Czech Republic →

Adjusted net national income (current US$)

This statistics in other country:

AfghanistanAlbaniaAlgeriaAngolaArab WorldArgentinaArmeniaAustraliaAustriaAzerbaijanBahamas, TheBahrainBangladeshBarbadosBelarusBelgiumBelizeBeninBhutanBoliviaBotswanaBrazilBrunei DarussalamBulgariaBurkina FasoBurundiCabo VerdeCambodiaCameroonCanadaCaribbean small statesCentral African RepublicCentral Europe and the BalticsChadChileChinaColombiaComorosCongo, Dem. Rep.Congo, Rep.Costa RicaCote d'IvoireCroatiaCubaCyprusCzech RepublicDenmarkDjiboutiDominicaDominican RepublicEarly-demographic dividendEast Asia & PacificEast Asia & Pacific (excluding high income)East Asia & Pacific (IDA & IBRD countries)EcuadorEgypt, Arab Rep.El SalvadorEquatorial GuineaEritreaEstoniaEthiopiaEuro areaEurope & Central AsiaEurope & Central Asia (excluding high income)Europe & Central Asia (IDA & IBRD countries)European UnionFijiFinlandFragile and conflict affected situationsFranceGabonGambia, TheGeorgiaGermanyGhanaGreeceGuatemalaGuineaGuinea-BissauGuyanaHaitiHeavily indebted poor countries (HIPC)High incomeHondurasHong Kong SAR, ChinaHungaryIBRD onlyIcelandIDA & IBRD totalIDA blendIDA onlyIDA totalIndiaIndonesiaIran, Islamic Rep.IraqIrelandIsraelItalyJamaicaJapanJordanKazakhstanKenyaKiribatiKorea, Rep.KuwaitKyrgyz RepublicLao PDRLate-demographic dividendLatin America & Caribbean Latin America & Caribbean (excluding high income)Latin America & the Caribbean (IDA & IBRD countries)LatviaLeast developed countries: UN classificationLebanonLesothoLiberiaLibyaLithuaniaLow & middle incomeLow incomeLower middle incomeLuxembourgMacedonia, FYRMadagascarMalawiMalaysiaMaldivesMaliMauritaniaMauritiusMexicoMiddle East & North AfricaMiddle East & North Africa (excluding high income)Middle East & North Africa (IDA & IBRD countries)Middle incomeMoldovaMongoliaMoroccoMozambiqueMyanmarNamibiaNepalNetherlandsNew ZealandNicaraguaNigerNigeriaNorth AmericaNorwayOECD membersOmanOther small statesPacific island small statesPakistanPanamaPapua New GuineaParaguayPeruPhilippinesPolandPortugalPost-demographic dividendPre-demographic dividendQatarRomaniaRussian FederationRwandaSamoaSao Tome and PrincipeSaudi ArabiaSenegalSeychellesSierra LeoneSingaporeSlovak RepublicSloveniaSmall statesSolomon IslandsSouth AfricaSouth AsiaSouth Asia (IDA & IBRD)SpainSri LankaSt. LuciaSt. Vincent and the GrenadinesSub-Saharan Africa Sub-Saharan Africa (excluding high income)Sub-Saharan Africa (IDA & IBRD countries)SudanSurinameSwazilandSwedenSwitzerlandSyrian Arab RepublicTajikistanTanzaniaThailandTogoTongaTrinidad and TobagoTunisiaTurkeyTurkmenistanUgandaUkraineUnited Arab EmiratesUnited KingdomUnited StatesUpper middle incomeUruguayUzbekistanVanuatuVenezuela, RBVietnamWorldYemen, Rep.ZambiaZimbabwe

Timeline:

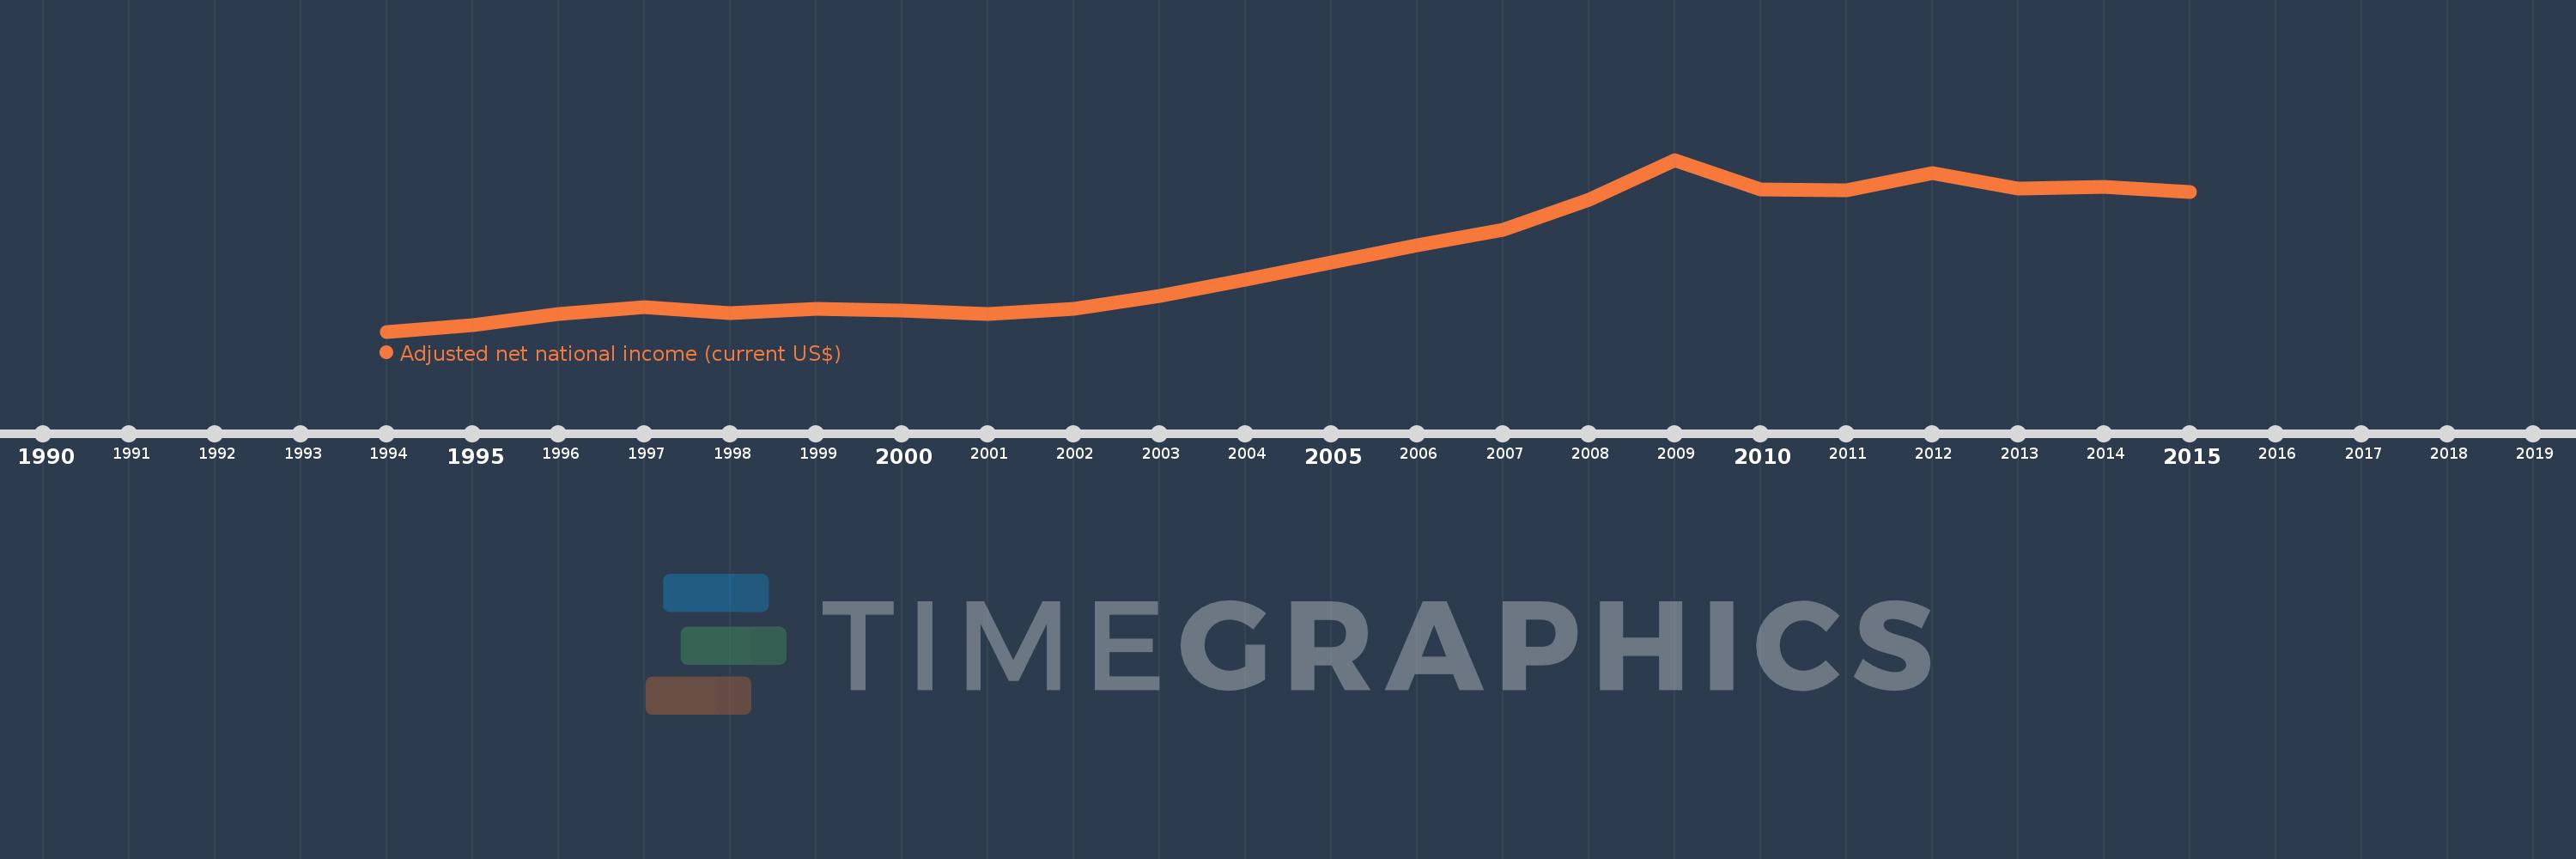
This timeline shows a graph from 1994 to 2015 of Czech Republic. No data until 1993. Number of actual observations by date: 22.

Source name:

World Development Indicators

Source organization:

World Bank staff estimates based on sources and methods in World Bank's "The Changing Wealth of Nations: Measuring Sustainable Development in the New Millennium" (2011).

Categories, topics:

Economy & Growth

Last updated:

apr 23, 2017

Indicators value changes by year

Meaning:
93.498 bln
Minimum:
32.005 bln
jan 1, 1994
Maximum:
171.202 bln
jan 1, 2009
At the date of observation
Value
Absolute change
Change from the previous value
jan 1, 1994
32.005 bln
+32.005 bln
0.0%
jan 1, 1995
37.482 bln
+5.477 bln
17.11%
jan 1, 1996
46.475 bln
+8.993 bln
23.99%
jan 1, 1997
52.024 bln
+5.549 bln
11.94%
jan 1, 1998
47.236 bln
-4.787 bln
-9.2%
jan 1, 1999
50.792 bln
+3.555 bln
7.53%
jan 1, 2000
48.934 bln
-1.857 bln
-3.66%
jan 1, 2001
46.232 bln
-2.702 bln
-5.52%
jan 1, 2002
50.411 bln
+4.179 bln
9.04%
jan 1, 2003
60.873 bln
+10.463 bln
20.76%
jan 1, 2004
74.307 bln
+13.434 bln
22.07%
jan 1, 2005
88.342 bln
+14.035 bln
18.89%
jan 1, 2006
101.795 bln
+13.453 bln
15.23%
jan 1, 2007
114.406 bln
+12.611 bln
12.39%
jan 1, 2008
138.708 bln
+24.303 bln
21.24%
jan 1, 2009
171.202 bln
+32.494 bln
23.43%
jan 1, 2010
146.89 bln
-24.313 bln
-14.2%
jan 1, 2011
146.375 bln
-514.161 mln
-0.35%
jan 1, 2012
160.359 bln
+13.983 bln
9.55%
jan 1, 2013
148.123 bln
-12.236 bln
-7.63%
jan 1, 2014
149.164 bln
+1.041 bln
0.7%
jan 1, 2015
144.831 bln
-4.333 bln
-2.9%

Ranking of countries by current statistics by years