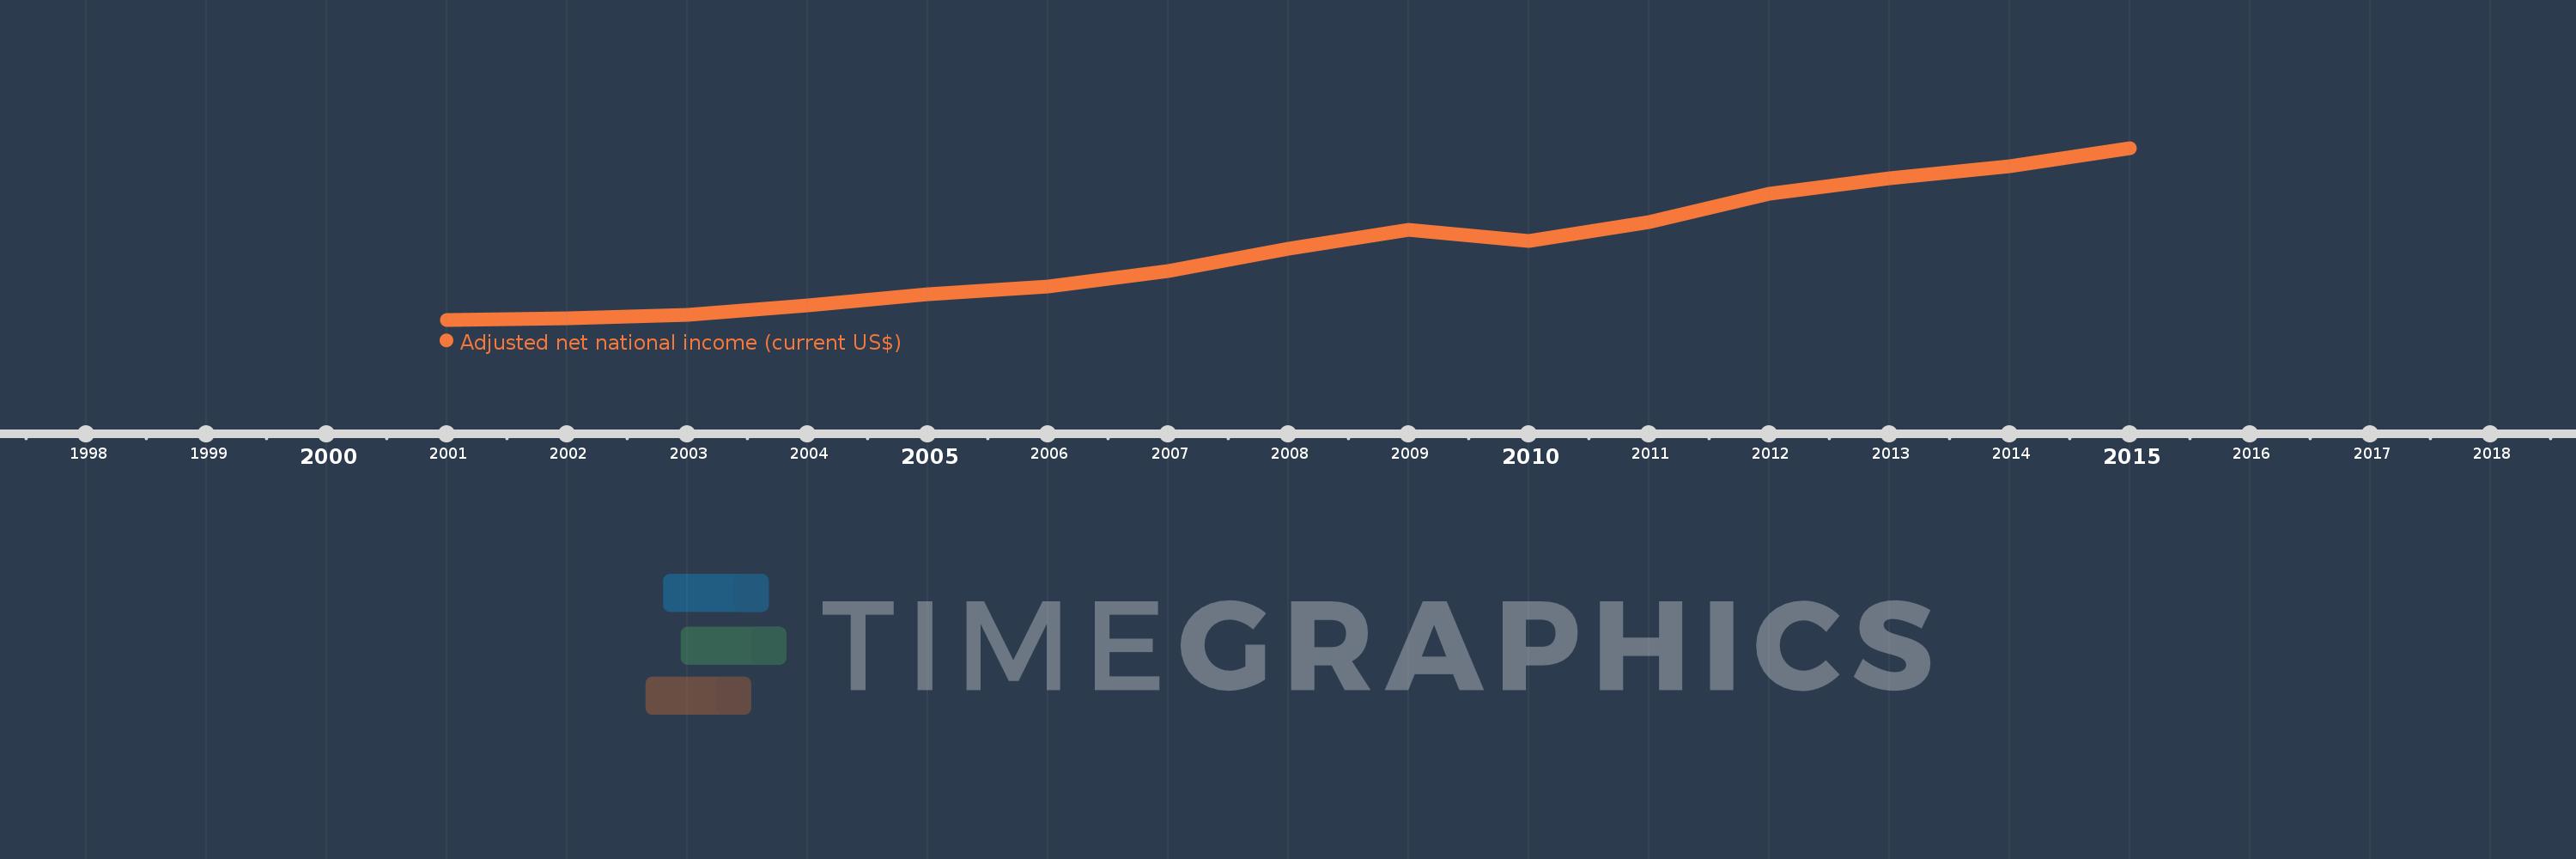
This timeline shows a graph from 2001 to 2015 of Small states. No data until 2000. Number of actual observations by date: 15.
Source name:
World Development Indicators
Source organization:
World Bank staff estimates based on sources and methods in World Bank's "The Changing Wealth of Nations: Measuring Sustainable Development in the New Millennium" (2011).
Categories, topics:
Economy & Growth
Last updated:
apr 23, 2017
Indicators value changes by year
Meaning:
205.908 bln
Minimum:
91.878 bln
jan 1, 2001
Maximum:
369.717 bln
jan 1, 2015
At the date of observation
Value
Absolute change
Change from the previous value
jan 1, 2001
91.878 bln
+91.878 bln
0.0%
jan 1, 2002
94.551 bln
+2.673 bln
2.91%
jan 1, 2003
100.054 bln
+5.503 bln
5.82%
jan 1, 2004
114.608 bln
+14.555 bln
14.55%
jan 1, 2005
132.731 bln
+18.122 bln
15.81%
jan 1, 2006
145.022 bln
+12.291 bln
9.26%
jan 1, 2007
171.294 bln
+26.273 bln
18.12%
jan 1, 2008
206.223 bln
+34.929 bln
20.39%
jan 1, 2009
236.81 bln
+30.587 bln
14.83%
jan 1, 2010
219.457 bln
-17.354 bln
-7.33%
jan 1, 2011
249.64 bln
+30.183 bln
13.75%
jan 1, 2012
296.114 bln
+46.474 bln
18.62%
jan 1, 2013
320.218 bln
+24.104 bln
8.14%
jan 1, 2014
340.303 bln
+20.086 bln
6.27%
jan 1, 2015
369.717 bln
+29.414 bln
8.64%
Ranking of countries by current statistics by years