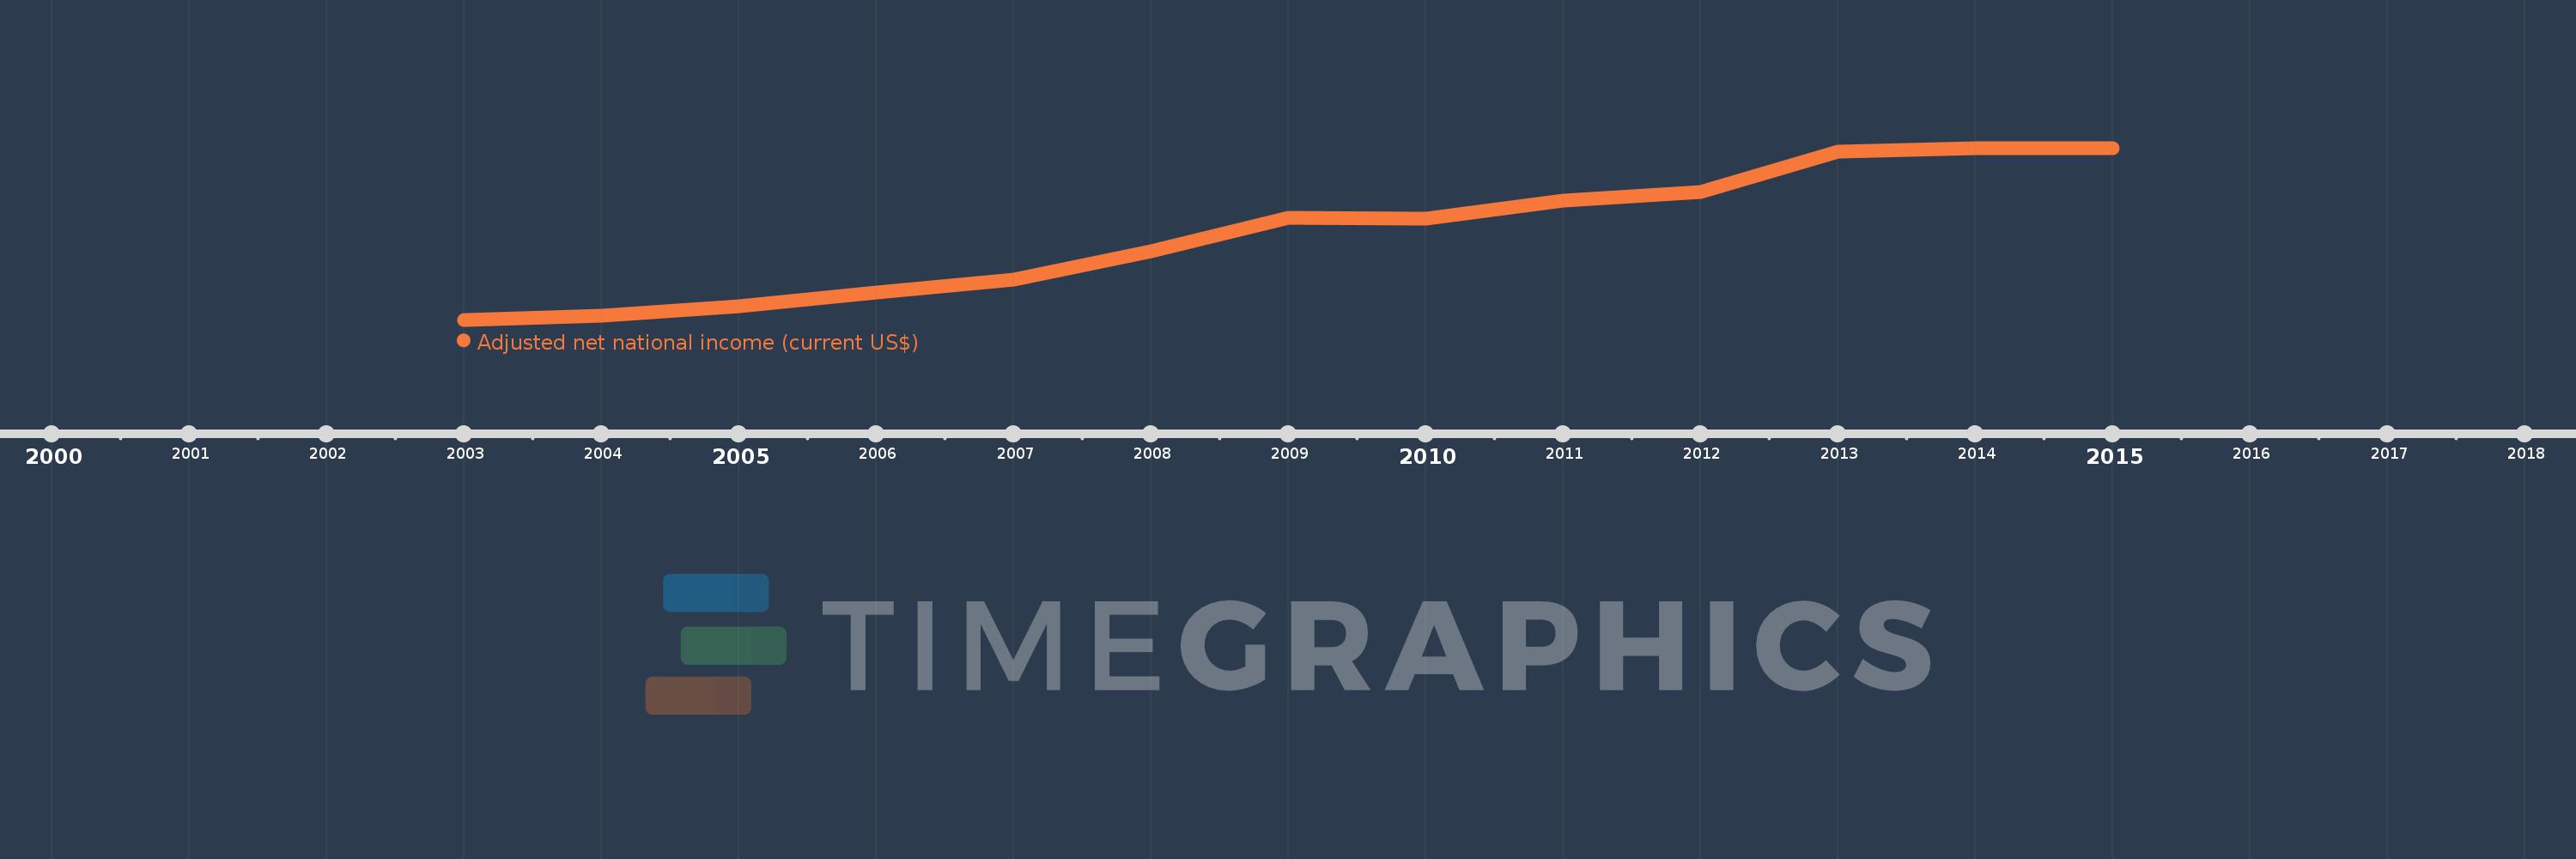
This timeline shows a graph from 2003 to 2015 of Fragile and conflict affected situations. No data until 2002. Number of actual observations by date: 13.
Source name:
World Development Indicators
Source organization:
World Bank staff estimates based on sources and methods in World Bank's "The Changing Wealth of Nations: Measuring Sustainable Development in the New Millennium" (2011).
Categories, topics:
Economy & Growth
Last updated:
apr 23, 2017
Indicators value changes by year
Meaning:
367.096 bln
Minimum:
146.811 bln
jan 1, 2003
Maximum:
588.52 bln
jan 1, 2014
At the date of observation
Value
Absolute change
Change from the previous value
jan 1, 2003
146.811 bln
+146.811 bln
0.0%
jan 1, 2004
157.396 bln
+10.585 bln
7.21%
jan 1, 2005
180.533 bln
+23.138 bln
14.7%
jan 1, 2006
216.756 bln
+36.223 bln
20.06%
jan 1, 2007
250.286 bln
+33.529 bln
15.47%
jan 1, 2008
323.024 bln
+72.739 bln
29.06%
jan 1, 2009
409.072 bln
+86.048 bln
26.64%
jan 1, 2010
406.248 bln
-2.825 bln
-0.69%
jan 1, 2011
452.236 bln
+45.988 bln
11.32%
jan 1, 2012
474.621 bln
+22.385 bln
4.95%
jan 1, 2013
579.25 bln
+104.628 bln
22.04%
jan 1, 2014
588.52 bln
+9.27 bln
1.6%
jan 1, 2015
587.491 bln
-1.029 bln
-0.17%
Ranking of countries by current statistics by years