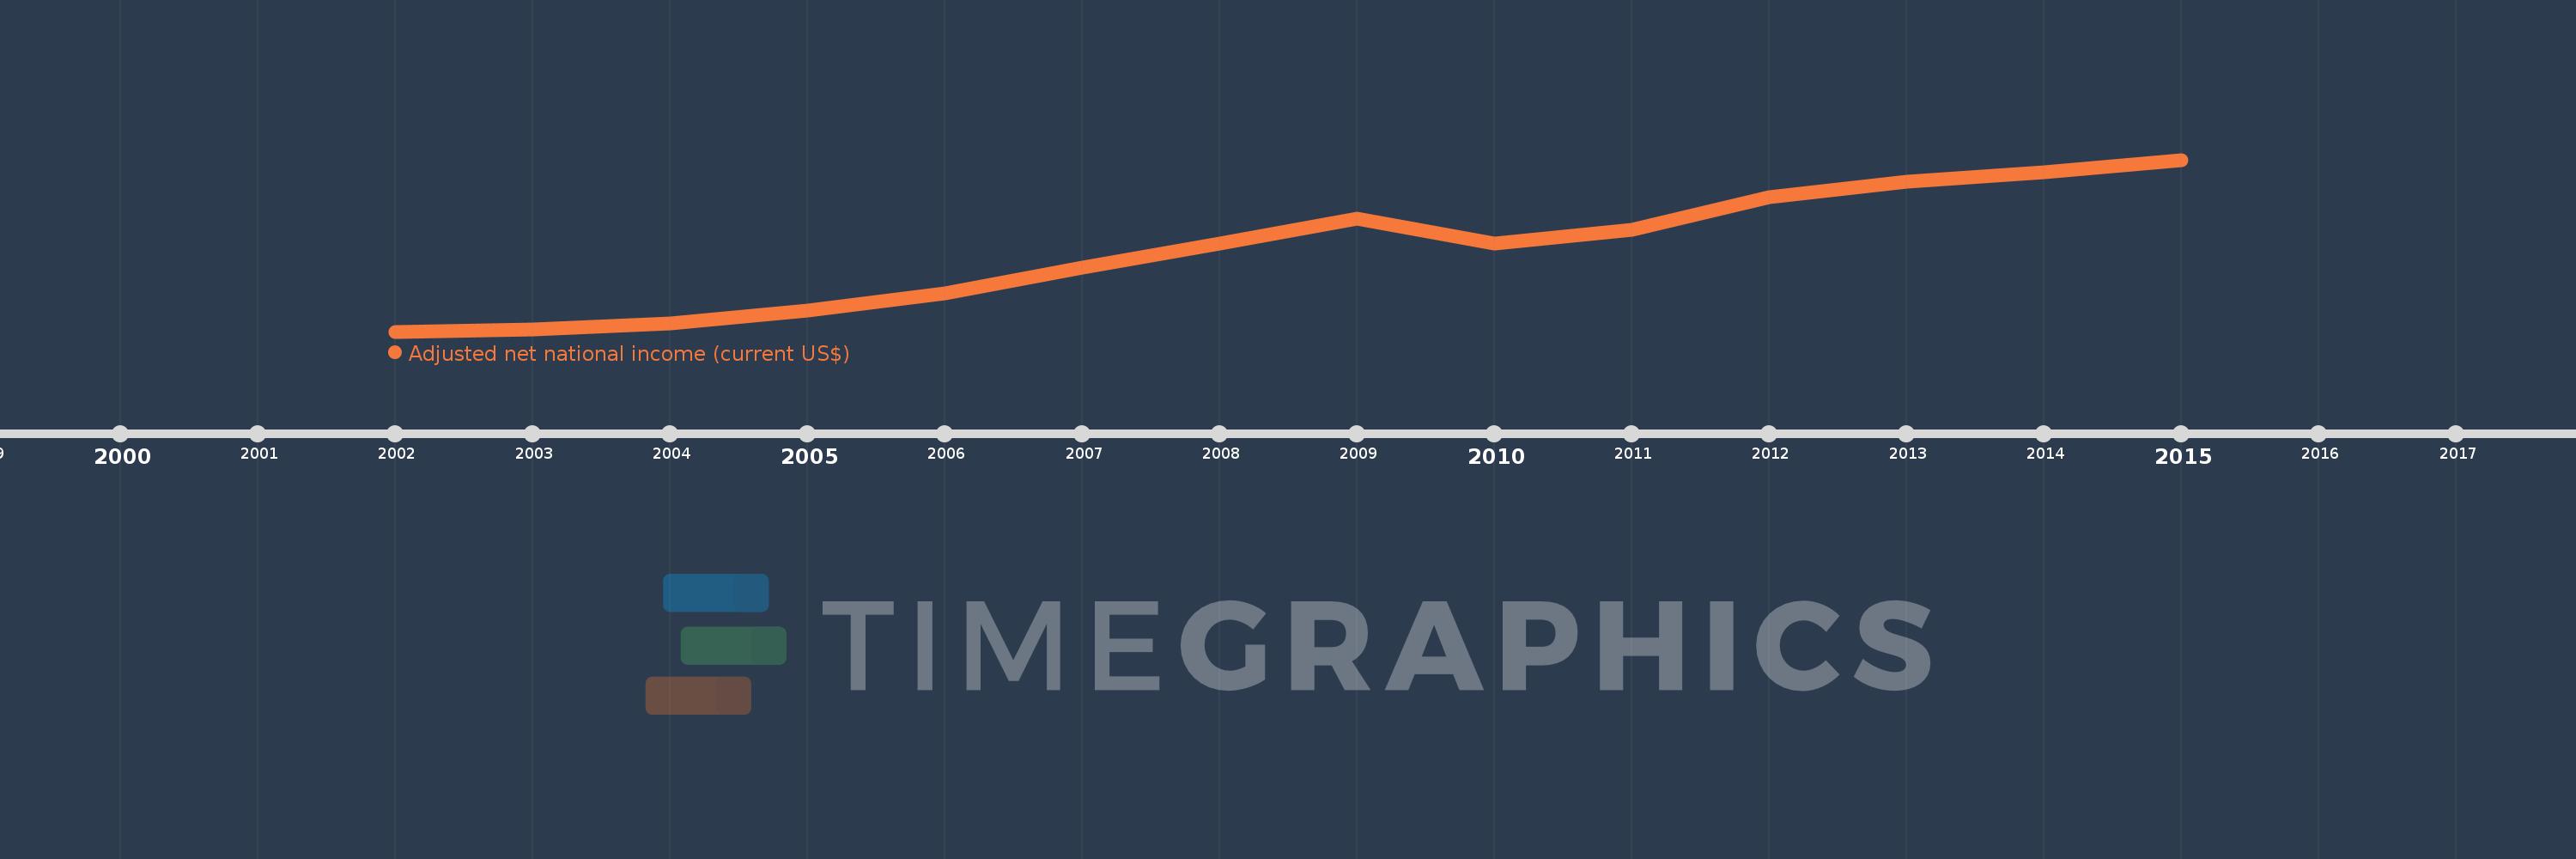
This timeline shows a graph from 2002 to 2015 of United Arab Emirates. No data until 2001. Number of actual observations by date: 14.
Source name:
World Development Indicators
Source organization:
World Bank staff estimates based on sources and methods in World Bank's "The Changing Wealth of Nations: Measuring Sustainable Development in the New Millennium" (2011).
Categories, topics:
Economy & Growth
Last updated:
apr 23, 2017
Indicators value changes by year
Meaning:
191.151 bln
Minimum:
84.413 bln
jan 1, 2002
Maximum:
309.72 bln
jan 1, 2015
At the date of observation
Value
Absolute change
Change from the previous value
jan 1, 2002
84.413 bln
+84.413 bln
0.0%
jan 1, 2003
86.717 bln
+2.304 bln
2.73%
jan 1, 2004
94.875 bln
+8.159 bln
9.41%
jan 1, 2005
111.654 bln
+16.779 bln
17.69%
jan 1, 2006
134.733 bln
+23.079 bln
20.67%
jan 1, 2007
167.917 bln
+33.184 bln
24.63%
jan 1, 2008
200.413 bln
+32.496 bln
19.35%
jan 1, 2009
232.816 bln
+32.403 bln
16.17%
jan 1, 2010
199.622 bln
-33.193 bln
-14.26%
jan 1, 2011
217.815 bln
+18.192 bln
9.11%
jan 1, 2012
260.256 bln
+42.442 bln
19.49%
jan 1, 2013
281.297 bln
+21.041 bln
8.08%
jan 1, 2014
293.863 bln
+12.566 bln
4.47%
jan 1, 2015
309.72 bln
+15.857 bln
5.4%
Ranking of countries by current statistics by years