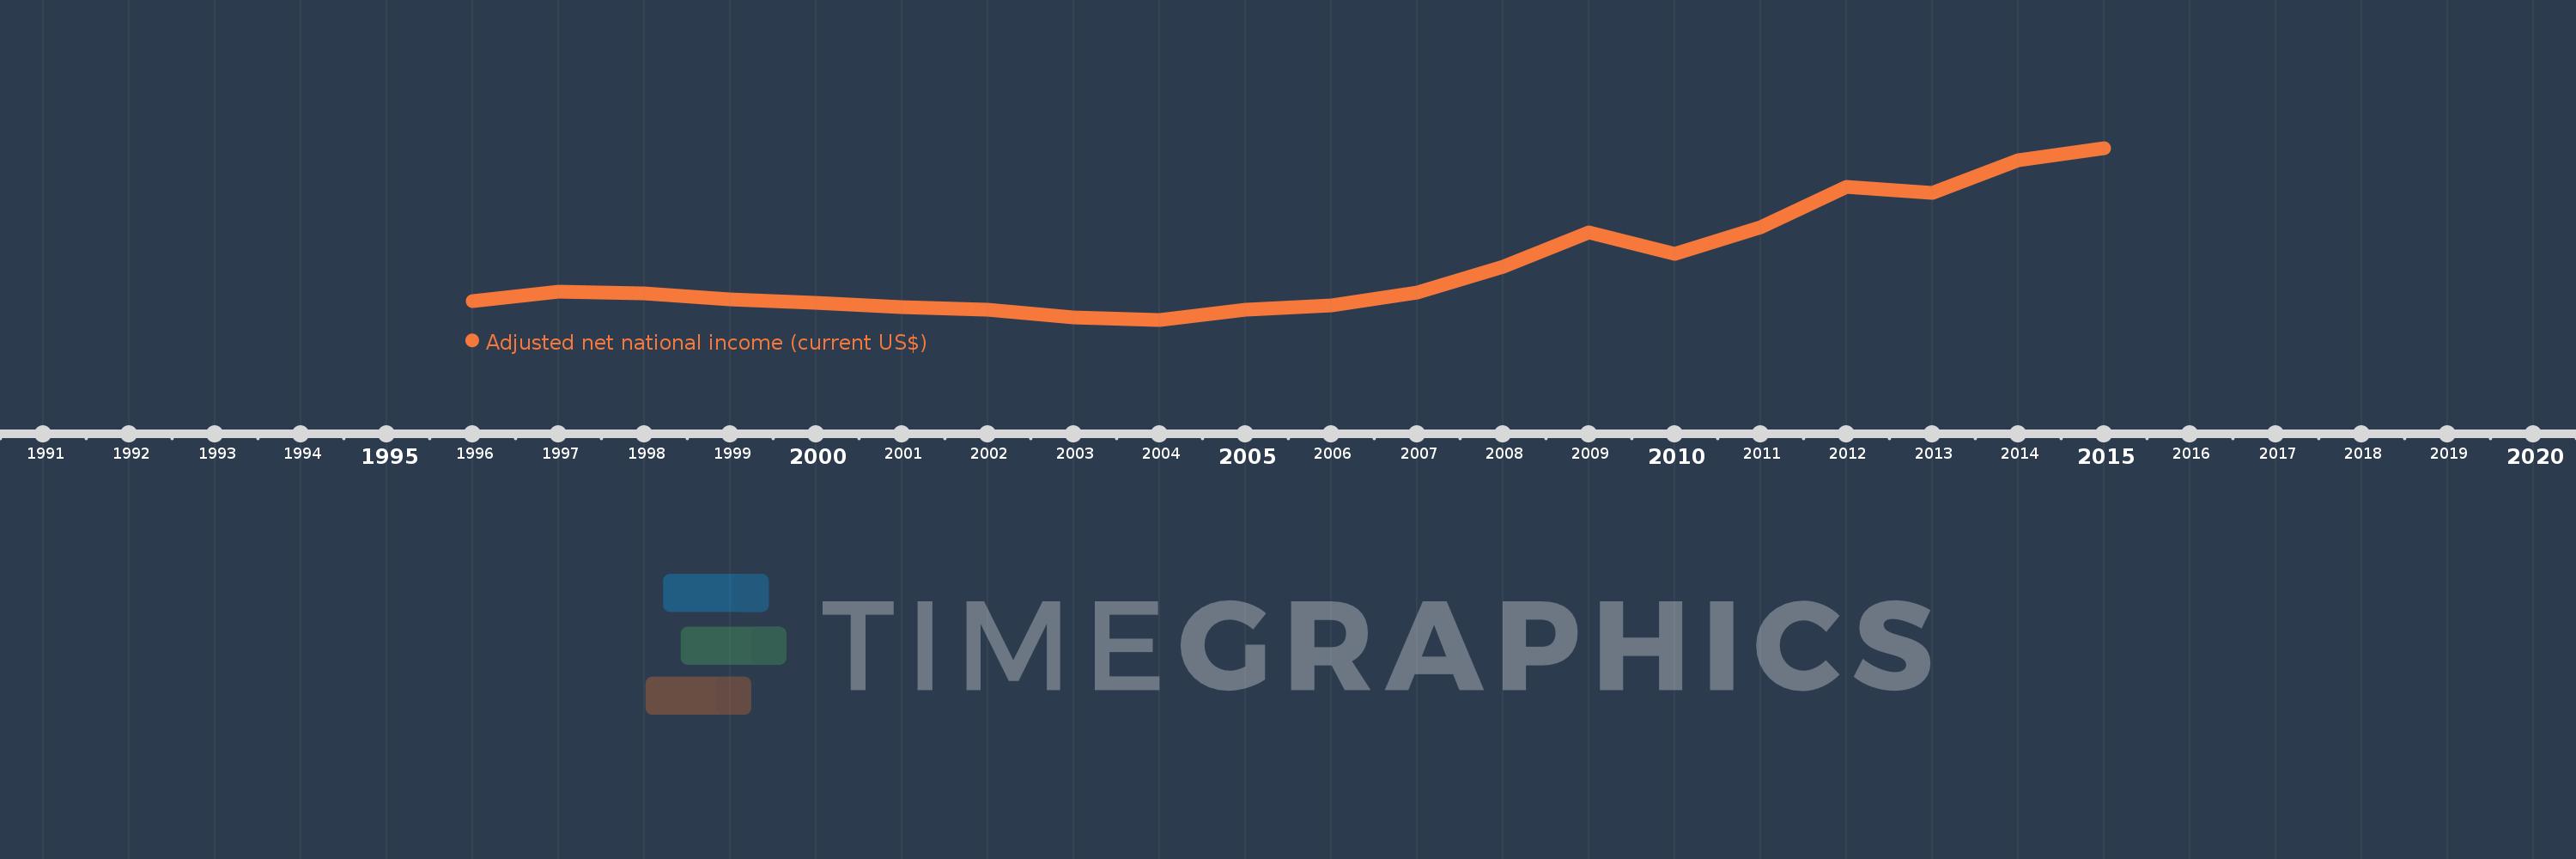
This timeline shows a graph from 1996 to 2015 of Paraguay. No data until 1995. Number of actual observations by date: 20.
Source name:
World Development Indicators
Source organization:
World Bank staff estimates based on sources and methods in World Bank's "The Changing Wealth of Nations: Measuring Sustainable Development in the New Millennium" (2011).
Categories, topics:
Economy & Growth
Last updated:
apr 23, 2017
Indicators value changes by year
Meaning:
11.152 bln
Minimum:
4.474 bln
jan 1, 2004
Maximum:
25.775 bln
jan 1, 2015
At the date of observation
Value
Absolute change
Change from the previous value
jan 1, 1996
6.822 bln
+6.822 bln
0.0%
jan 1, 1997
7.93 bln
+1.108 bln
16.24%
jan 1, 1998
7.788 bln
-142.564 mln
-1.8%
jan 1, 1999
7.029 bln
-758.617 mln
-9.74%
jan 1, 2000
6.538 bln
-490.647 mln
-6.98%
jan 1, 2001
5.997 bln
-541.051 mln
-8.28%
jan 1, 2002
5.722 bln
-275.479 mln
-4.59%
jan 1, 2003
4.8 bln
-922.022 mln
-16.11%
jan 1, 2004
4.474 bln
-325.544 mln
-6.78%
jan 1, 2005
5.706 bln
+1.232 bln
27.53%
jan 1, 2006
6.226 bln
+520.366 mln
9.12%
jan 1, 2007
7.885 bln
+1.659 bln
26.64%
jan 1, 2008
11.078 bln
+3.193 bln
40.5%
jan 1, 2009
15.254 bln
+4.176 bln
37.69%
jan 1, 2010
12.659 bln
-2.595 bln
-17.01%
jan 1, 2011
15.945 bln
+3.286 bln
25.96%
jan 1, 2012
20.994 bln
+5.049 bln
31.67%
jan 1, 2013
20.166 bln
-828.384 mln
-3.95%
jan 1, 2014
24.252 bln
+4.086 bln
20.26%
jan 1, 2015
25.775 bln
+1.523 bln
6.28%
Ranking of countries by current statistics by years