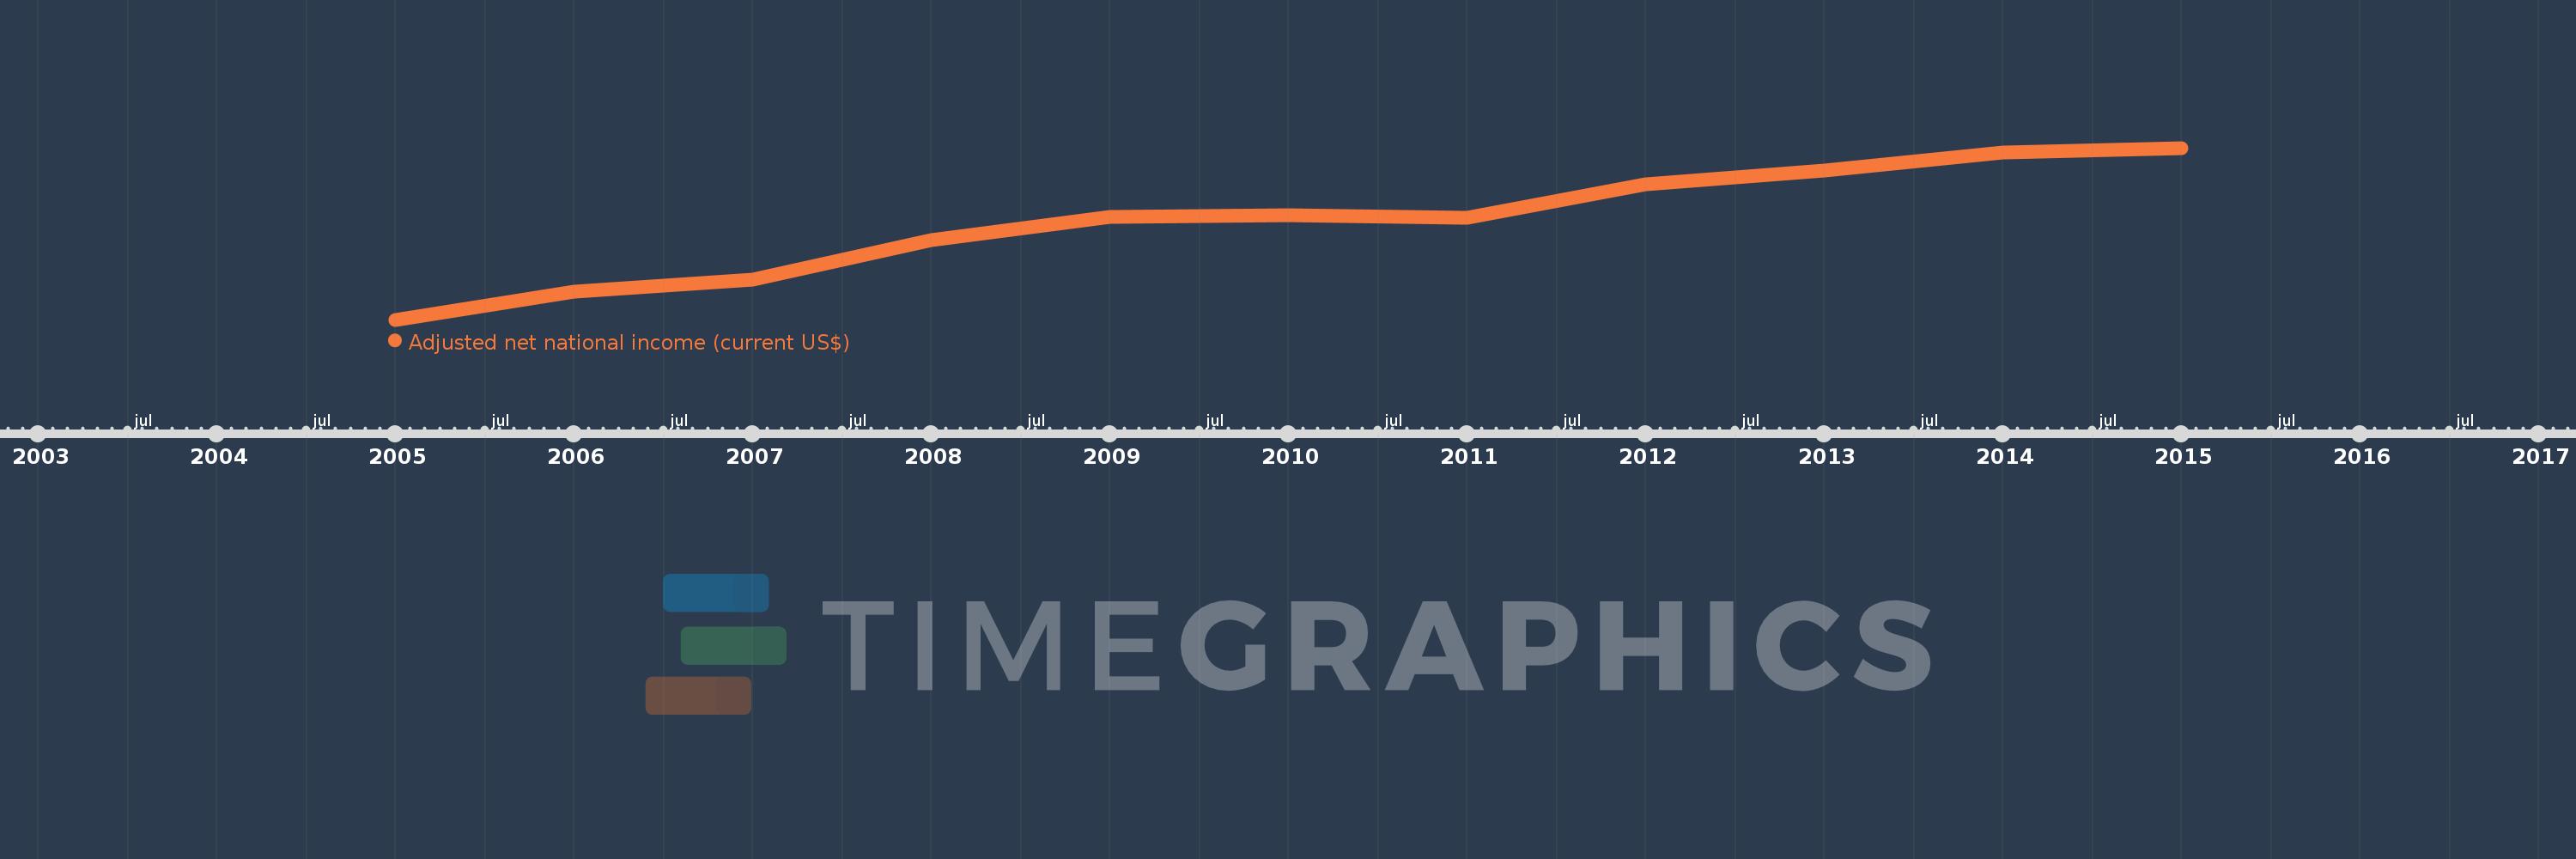
This timeline shows a graph from 2005 to 2015 of Haiti. No data until 2004. Number of actual observations by date: 11.
Source name:
World Development Indicators
Source organization:
World Bank staff estimates based on sources and methods in World Bank's "The Changing Wealth of Nations: Measuring Sustainable Development in the New Millennium" (2011).
Categories, topics:
Economy & Growth
Last updated:
apr 23, 2017
Indicators value changes by year
Meaning:
6.119 bln
Minimum:
3.449 bln
jan 1, 2005
Maximum:
8.118 bln
jan 1, 2015
At the date of observation
Value
Absolute change
Change from the previous value
jan 1, 2005
3.449 bln
+3.449 bln
0.0%
jan 1, 2006
4.206 bln
+756.712 mln
21.94%
jan 1, 2007
4.542 bln
+335.36 mln
7.97%
jan 1, 2008
5.617 bln
+1.075 bln
23.67%
jan 1, 2009
6.244 bln
+627.808 mln
11.18%
jan 1, 2010
6.292 bln
+47.749 mln
0.76%
jan 1, 2011
6.226 bln
-65.899 mln
-1.05%
jan 1, 2012
7.12 bln
+894.117 mln
14.36%
jan 1, 2013
7.5 bln
+379.455 mln
5.33%
jan 1, 2014
7.993 bln
+493.299 mln
6.58%
jan 1, 2015
8.118 bln
+124.629 mln
1.56%
Ranking of countries by current statistics by years