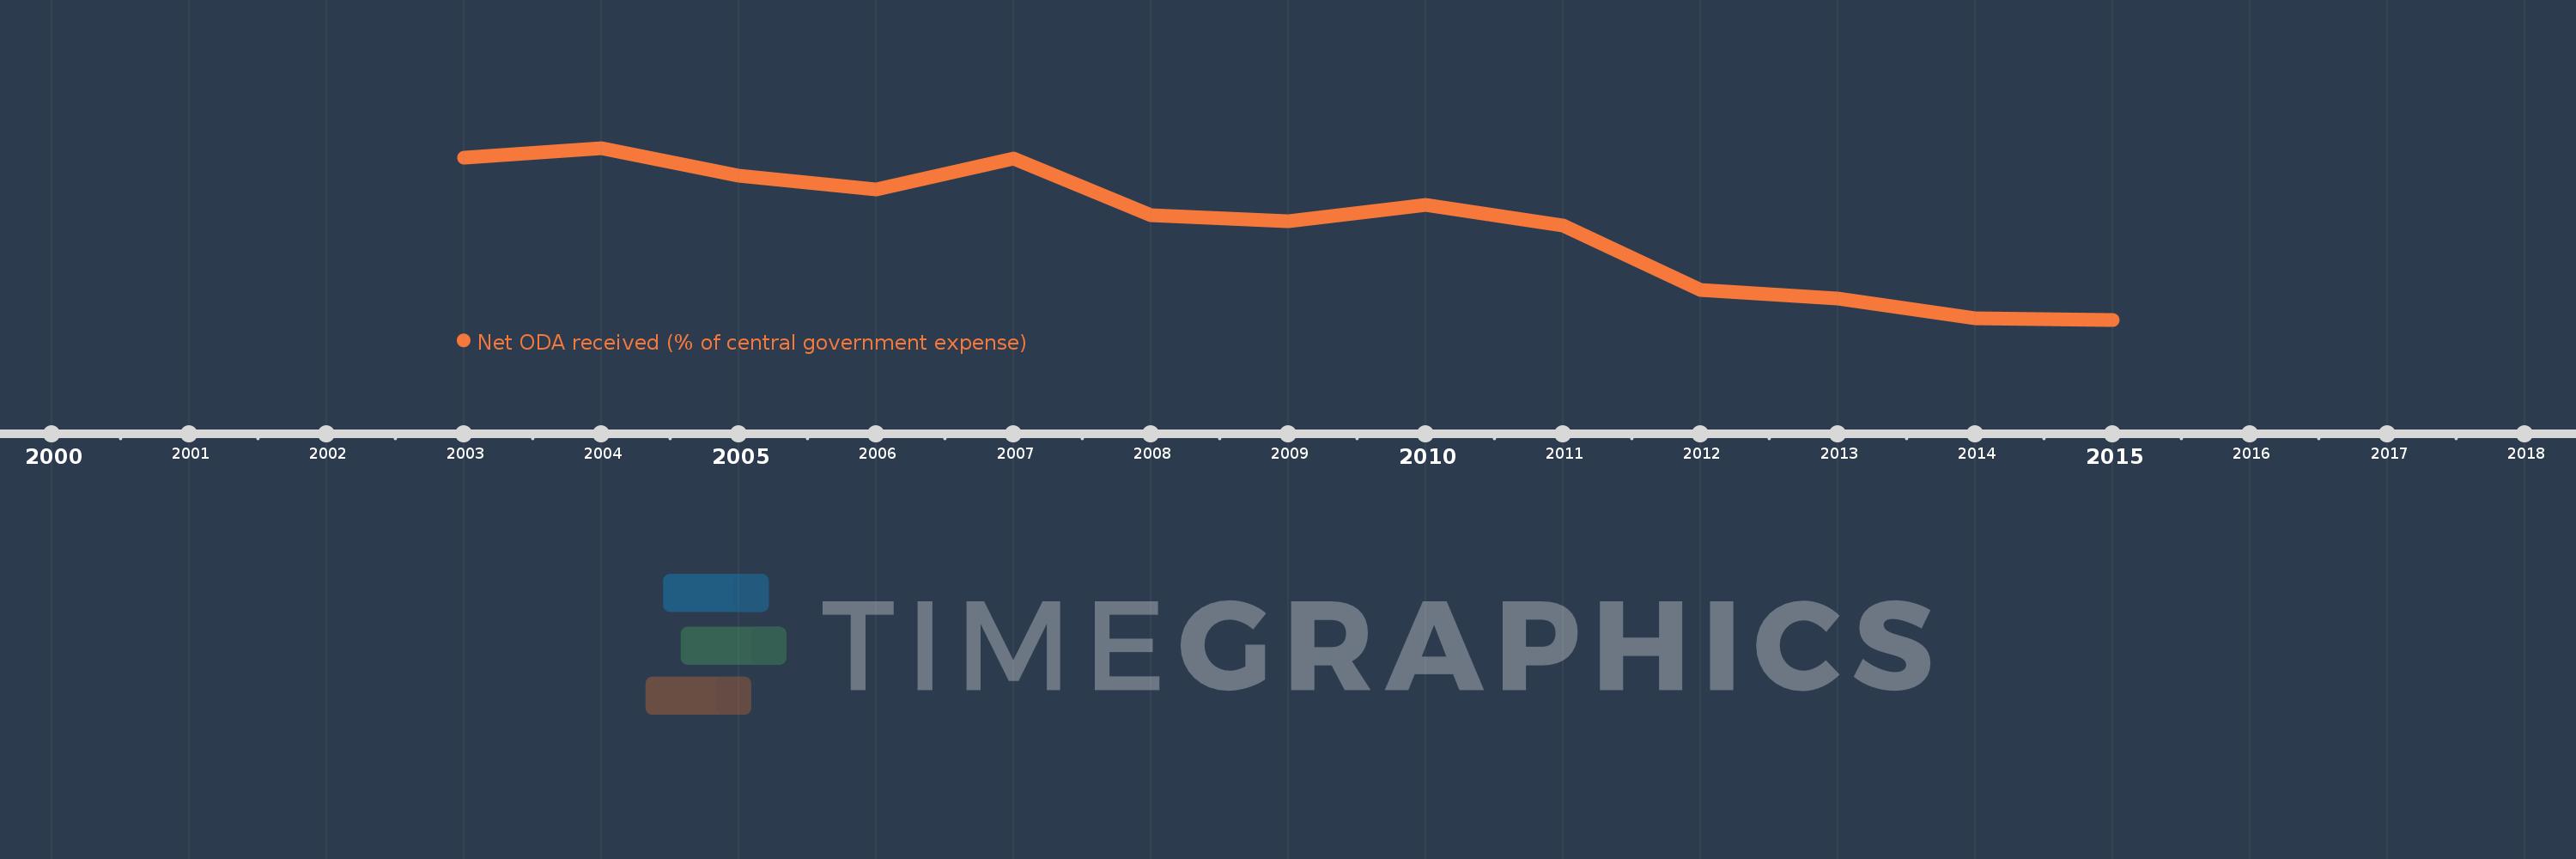
This timeline shows a graph from 2003 to 2015 of Burkina Faso. No data until 2002. Number of actual observations by date: 13.
Source name:
World Development Indicators
Source organization:
Development Assistance Committee of the Organisation for Economic Co-operation and Development, Geographical Distribution of Financial Flows to Developing Countries, Development Co-operation Report, and International Development Statistics database. Data are available online at: www.oecd.org/dac/stats/idsonline. IMF central government expense estimates are used for the denominator.
Categories, topics:
Aid Effectiveness
Last updated:
apr 23, 2017
Indicators value changes by year
Meaning:
97.669
Minimum:
62.448
jan 1, 2015
Maximum:
126.095
jan 1, 2004
At the date of observation
Value
Absolute change
Change from the previous value
jan 1, 2003
122.58
+122.58
0.0%
jan 1, 2004
126.095
+3.515
2.87%
jan 1, 2005
115.962
-10.134
-8.04%
jan 1, 2006
110.683
-5.278
-4.55%
jan 1, 2007
122.237
+11.553
10.44%
jan 1, 2008
101.254
-20.983
-17.17%
jan 1, 2009
98.828
-2.426
-2.4%
jan 1, 2010
105.15
+6.321
6.4%
jan 1, 2011
97.5
-7.65
-7.28%
jan 1, 2012
73.6
-23.899
-24.51%
jan 1, 2013
70.377
-3.223
-4.38%
jan 1, 2014
62.982
-7.395
-10.51%
jan 1, 2015
62.448
-0.534
-0.85%
Ranking of countries by current statistics by years