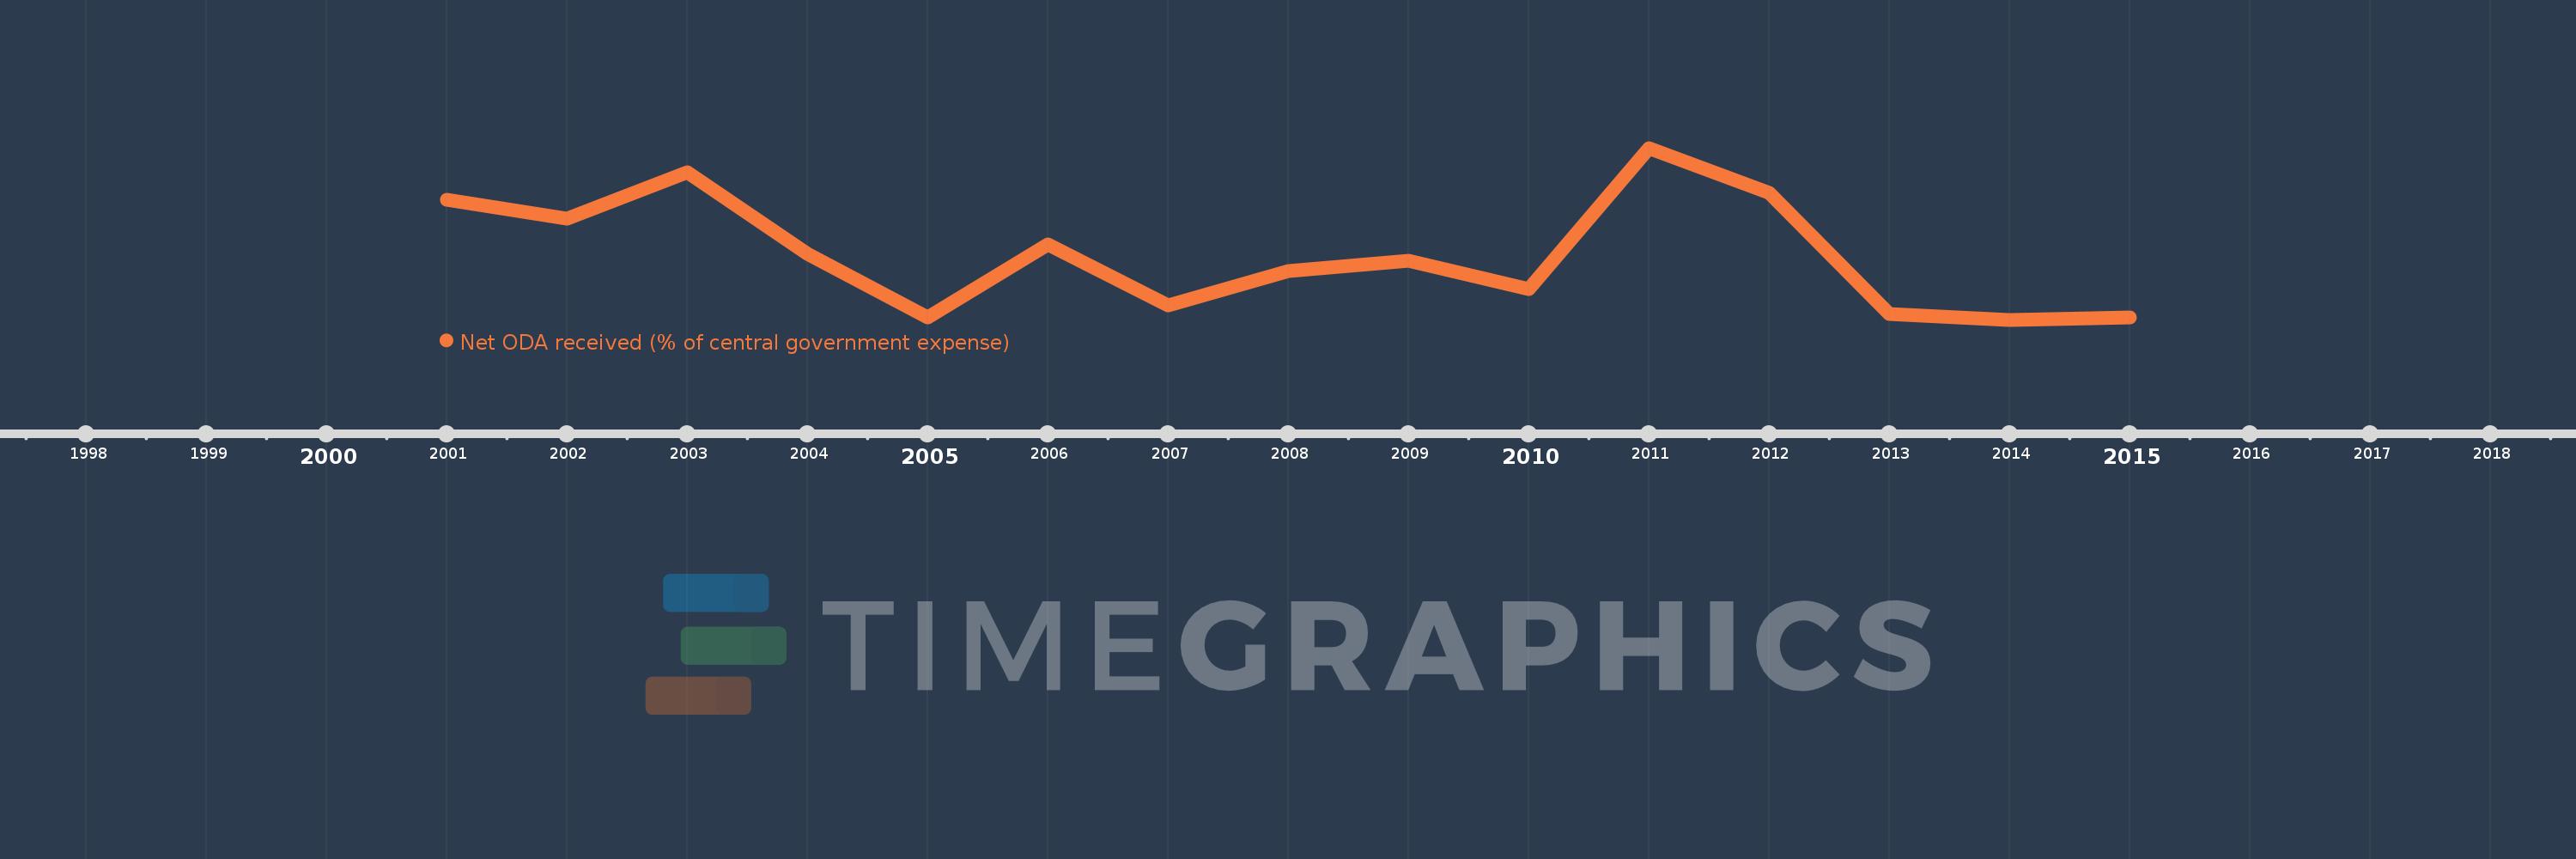
This timeline shows a graph from 2001 to 2015 of Antigua and Barbuda. No data until 2000. Number of actual observations by date: 15.
Source name:
World Development Indicators
Source organization:
Development Assistance Committee of the Organisation for Economic Co-operation and Development, Geographical Distribution of Financial Flows to Developing Countries, Development Co-operation Report, and International Development Statistics database. Data are available online at: www.oecd.org/dac/stats/idsonline. IMF central government expense estimates are used for the denominator.
Categories, topics:
Aid Effectiveness
Last updated:
apr 23, 2017
Indicators value changes by year
Meaning:
3.31
Minimum:
0.702
jan 1, 2014
Maximum:
7.614
jan 1, 2011
At the date of observation
Value
Absolute change
Change from the previous value
jan 1, 2001
5.535
+5.535
0.0%
jan 1, 2002
4.778
-0.756
-13.67%
jan 1, 2003
6.643
+1.865
39.03%
jan 1, 2004
3.344
-3.3
-49.67%
jan 1, 2005
0.796
-2.548
-76.2%
jan 1, 2006
3.734
+2.938
369.23%
jan 1, 2007
1.295
-2.44
-65.33%
jan 1, 2008
2.658
+1.364
105.33%
jan 1, 2009
3.083
+0.425
15.99%
jan 1, 2010
1.948
-1.135
-36.82%
jan 1, 2011
7.614
+5.666
290.88%
jan 1, 2012
5.799
-1.815
-23.84%
jan 1, 2013
0.945
-4.854
-83.71%
jan 1, 2014
0.702
-0.243
-25.75%
jan 1, 2015
0.782
+0.08
11.43%
Ranking of countries by current statistics by years