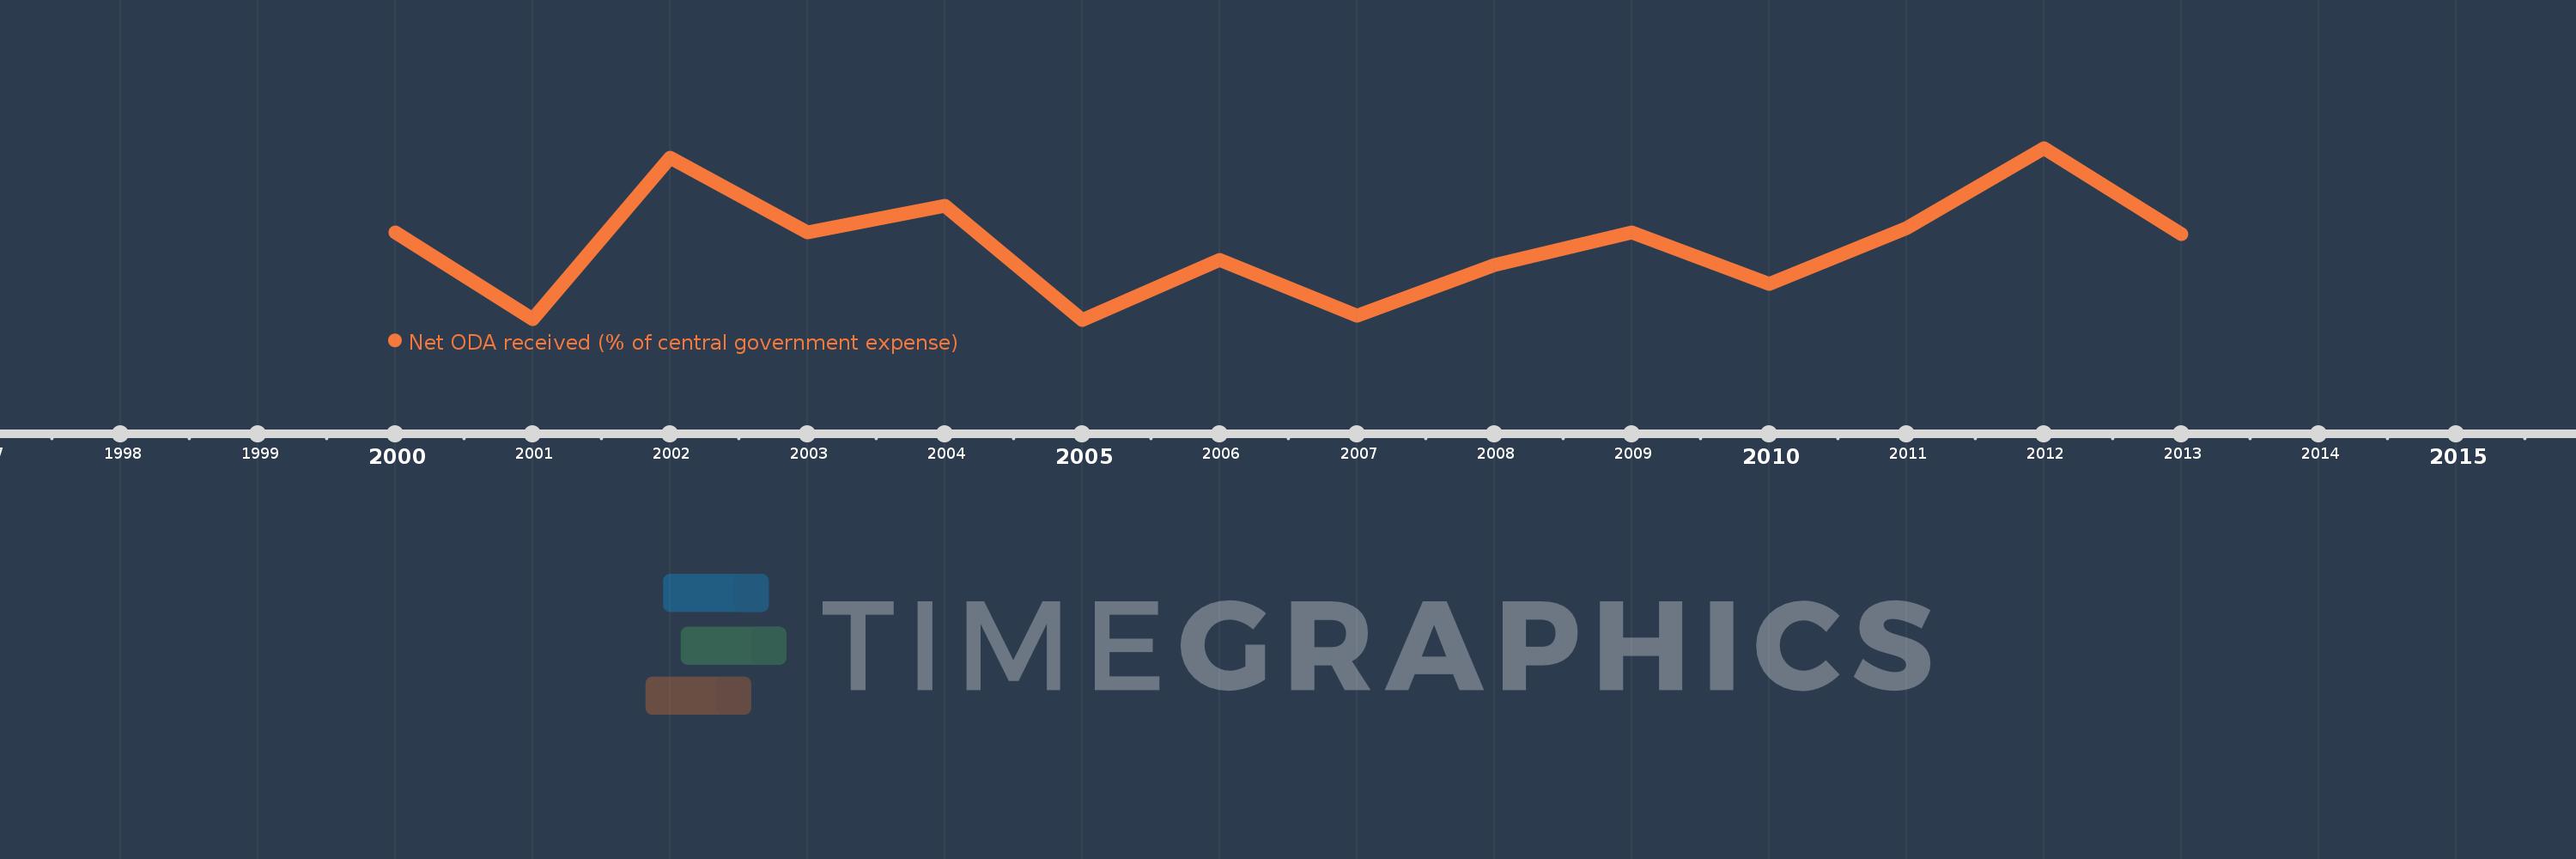
This timeline shows a graph from 2000 to 2013 of Swaziland. No data until 1999. Number of actual observations by date: 14.
Source name:
World Development Indicators
Source organization:
Development Assistance Committee of the Organisation for Economic Co-operation and Development, Geographical Distribution of Financial Flows to Developing Countries, Development Co-operation Report, and International Development Statistics database. Data are available online at: www.oecd.org/dac/stats/idsonline. IMF central government expense estimates are used for the denominator.
Categories, topics:
Aid Effectiveness
Last updated:
apr 23, 2017
Indicators value changes by year
Meaning:
7.615
Minimum:
4.589
jan 1, 2005
Maximum:
11.565
jan 1, 2012
At the date of observation
Value
Absolute change
Change from the previous value
jan 1, 2000
8.133
+8.133
0.0%
jan 1, 2001
4.62
-3.513
-43.19%
jan 1, 2002
11.175
+6.555
141.89%
jan 1, 2003
8.148
-3.027
-27.09%
jan 1, 2004
9.209
+1.061
13.02%
jan 1, 2005
4.589
-4.62
-50.17%
jan 1, 2006
7.029
+2.44
53.18%
jan 1, 2007
4.749
-2.28
-32.43%
jan 1, 2008
6.801
+2.052
43.2%
jan 1, 2009
8.149
+1.348
19.82%
jan 1, 2010
6.043
-2.106
-25.84%
jan 1, 2011
8.317
+2.274
37.63%
jan 1, 2012
11.565
+3.248
39.05%
jan 1, 2013
8.078
-3.486
-30.15%
Ranking of countries by current statistics by years