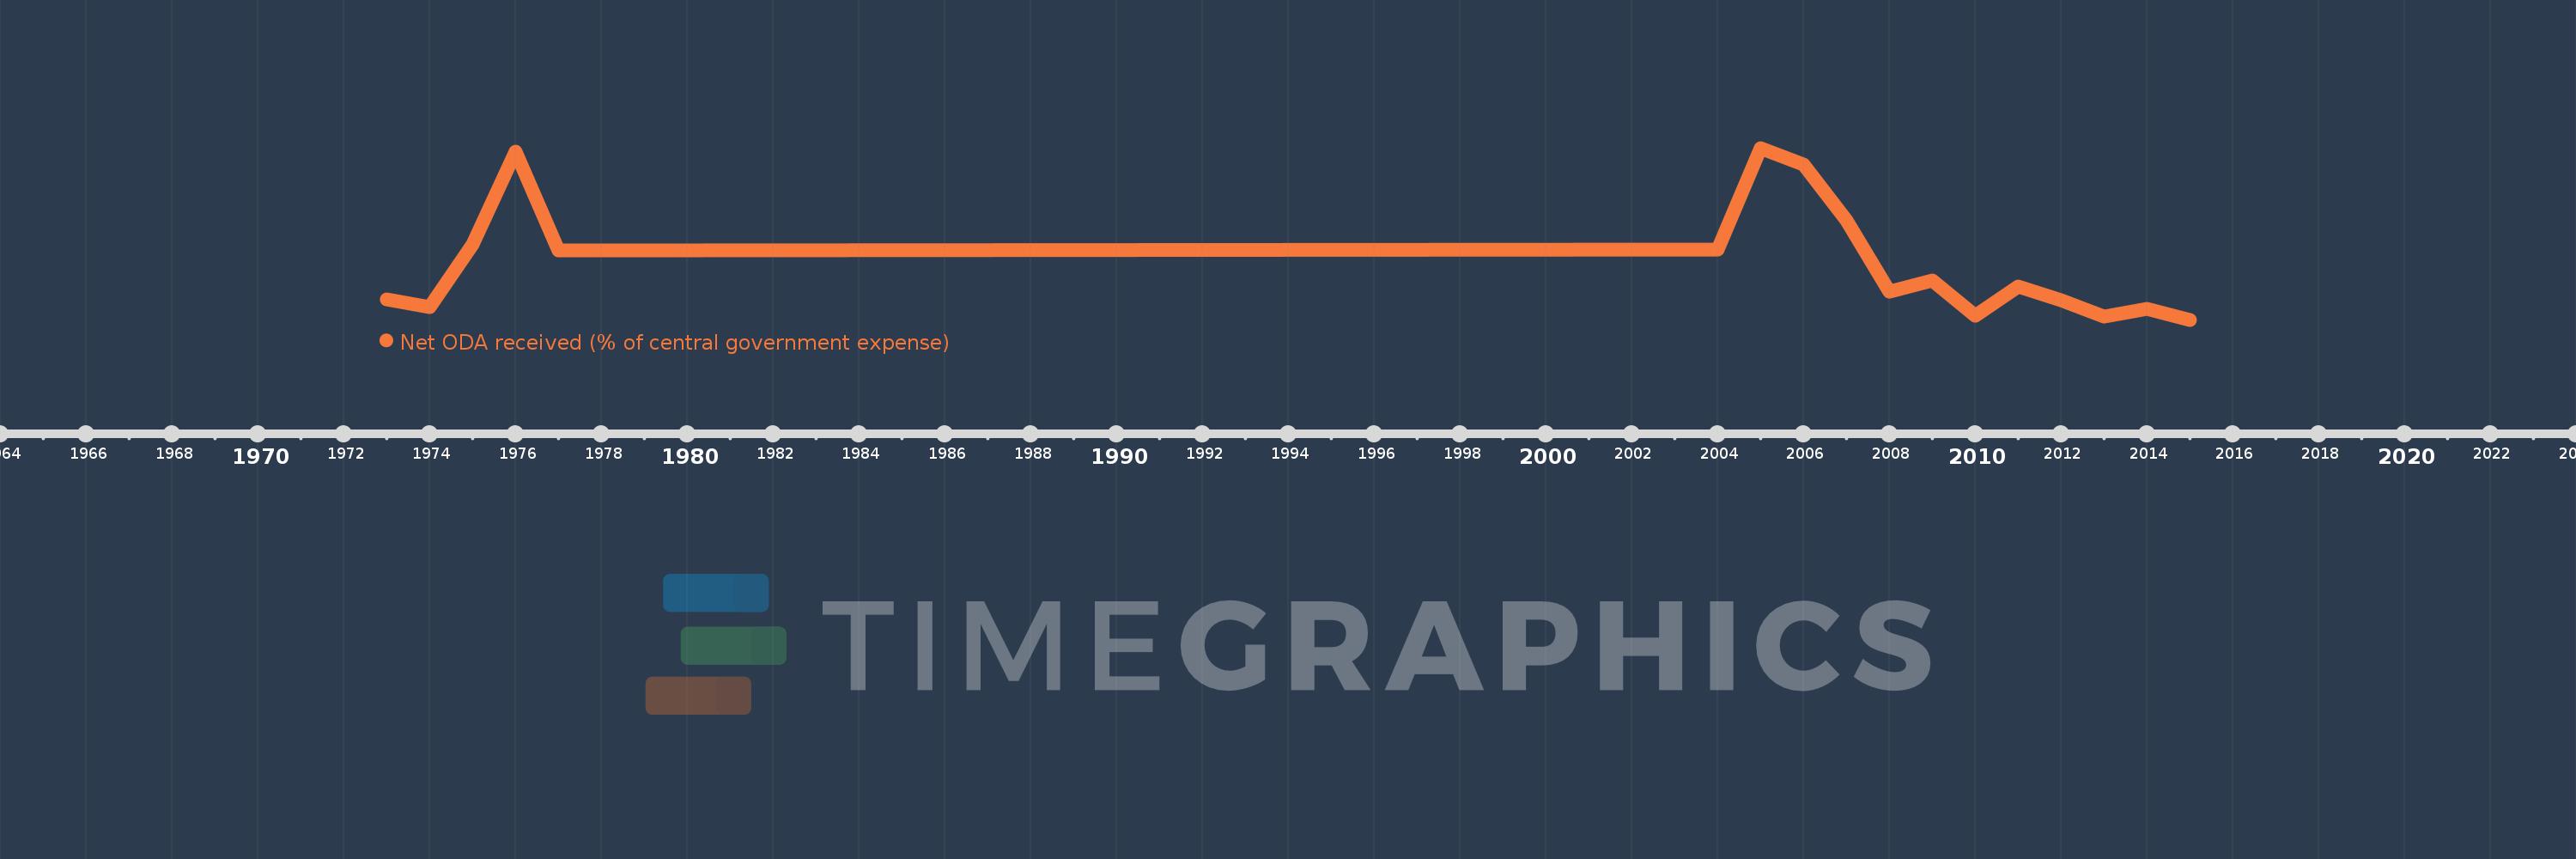
This timeline shows a graph from 1973 to 2015 of Honduras. No data until 1972. Number of actual observations by date: 17.
Source name:
World Development Indicators
Source organization:
Development Assistance Committee of the Organisation for Economic Co-operation and Development, Geographical Distribution of Financial Flows to Developing Countries, Development Co-operation Report, and International Development Statistics database. Data are available online at: www.oecd.org/dac/stats/idsonline. IMF central government expense estimates are used for the denominator.
Categories, topics:
Aid Effectiveness
Last updated:
apr 23, 2017
Indicators value changes by year
Meaning:
21.314
Minimum:
12.698
jan 1, 2015
Maximum:
38.381
jan 1, 2005
At the date of observation
Value
Absolute change
Change from the previous value
jan 1, 1973
15.745
+15.745
0.0%
jan 1, 1974
14.646
-1.099
-6.98%
jan 1, 1975
23.929
+9.284
63.39%
jan 1, 1976
37.787
+13.858
57.91%
jan 1, 1977
23.055
-14.732
-38.99%
jan 1, 2004
23.142
+0.087
0.38%
jan 1, 2005
38.381
+15.239
65.85%
jan 1, 2006
35.885
-2.496
-6.5%
jan 1, 2007
27.537
-8.348
-23.26%
jan 1, 2008
16.869
-10.668
-38.74%
jan 1, 2009
18.562
+1.693
10.04%
jan 1, 2010
13.335
-5.227
-28.16%
jan 1, 2011
17.697
+4.361
32.7%
jan 1, 2012
15.647
-2.05
-11.58%
jan 1, 2013
13.142
-2.505
-16.01%
jan 1, 2014
14.289
+1.148
8.73%
jan 1, 2015
12.698
-1.592
-11.14%
Ranking of countries by current statistics by years