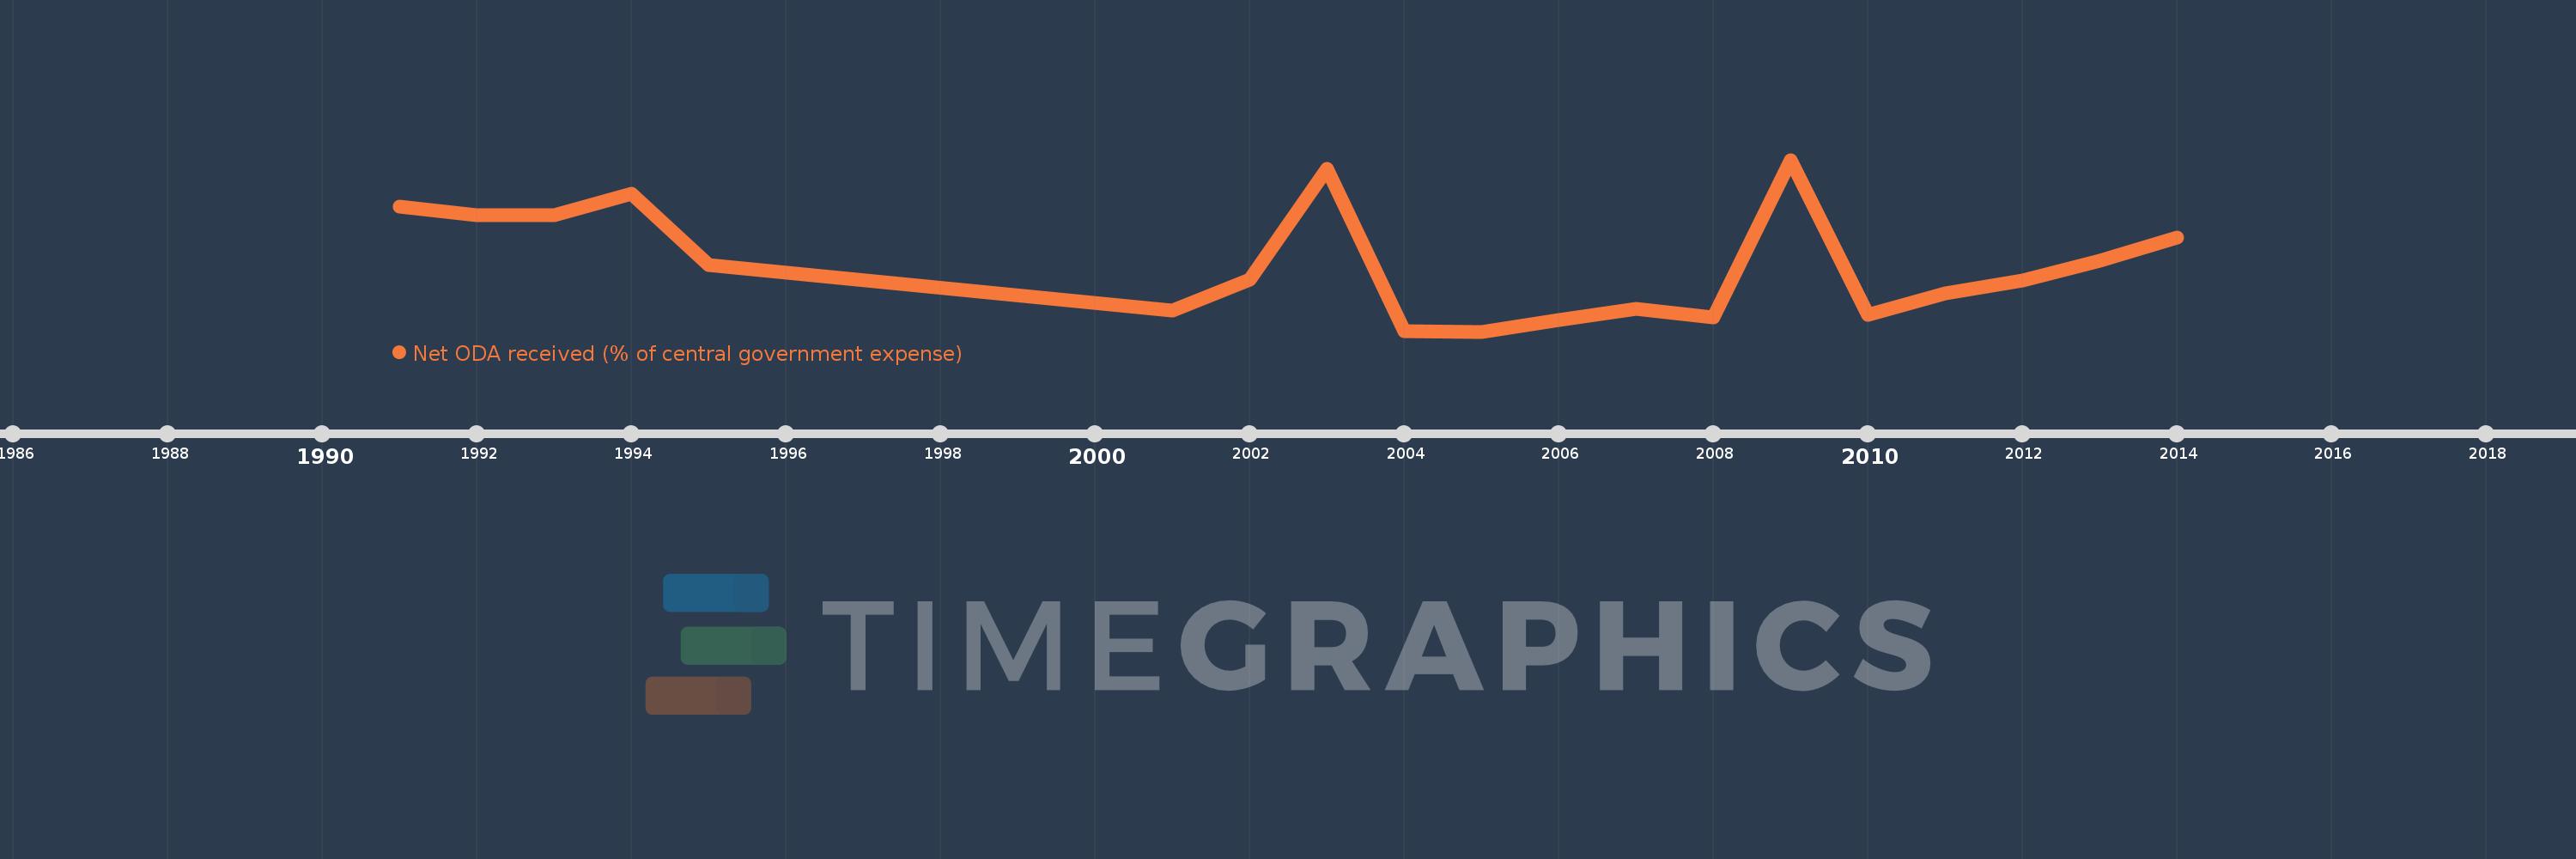
This timeline shows a graph from 1991 to 2014 of St. Kitts and Nevis. No data until 1990. Number of actual observations by date: 19.
Source name:
World Development Indicators
Source organization:
Development Assistance Committee of the Organisation for Economic Co-operation and Development, Geographical Distribution of Financial Flows to Developing Countries, Development Co-operation Report, and International Development Statistics database. Data are available online at: www.oecd.org/dac/stats/idsonline. IMF central government expense estimates are used for the denominator.
Categories, topics:
Aid Effectiveness
Last updated:
apr 23, 2017
Indicators value changes by year
Meaning:
11.609
Minimum:
0.037
jan 1, 2005
Maximum:
29.33
jan 1, 2009
At the date of observation
Value
Absolute change
Change from the previous value
jan 1, 1991
21.275
+21.275
0.0%
jan 1, 1992
19.85
-1.425
-6.7%
jan 1, 1993
19.826
-0.024
-0.12%
jan 1, 1994
23.578
+3.752
18.92%
jan 1, 1995
11.447
-12.132
-51.45%
jan 1, 2001
3.565
-7.882
-68.86%
jan 1, 2002
8.9
+5.335
149.68%
jan 1, 2003
27.756
+18.855
211.85%
jan 1, 2004
0.158
-27.597
-99.43%
jan 1, 2005
0.037
-0.121
-76.33%
jan 1, 2006
2.064
+2.026
5.4K%
jan 1, 2007
3.91
+1.846
89.46%
jan 1, 2008
2.452
-1.458
-37.29%
jan 1, 2009
29.33
+26.878
1.1K%
jan 1, 2010
2.949
-26.381
-89.95%
jan 1, 2011
6.517
+3.568
121.01%
jan 1, 2012
8.752
+2.235
34.3%
jan 1, 2013
12.1
+3.348
38.26%
jan 1, 2014
16.115
+4.015
33.18%
Ranking of countries by current statistics by years