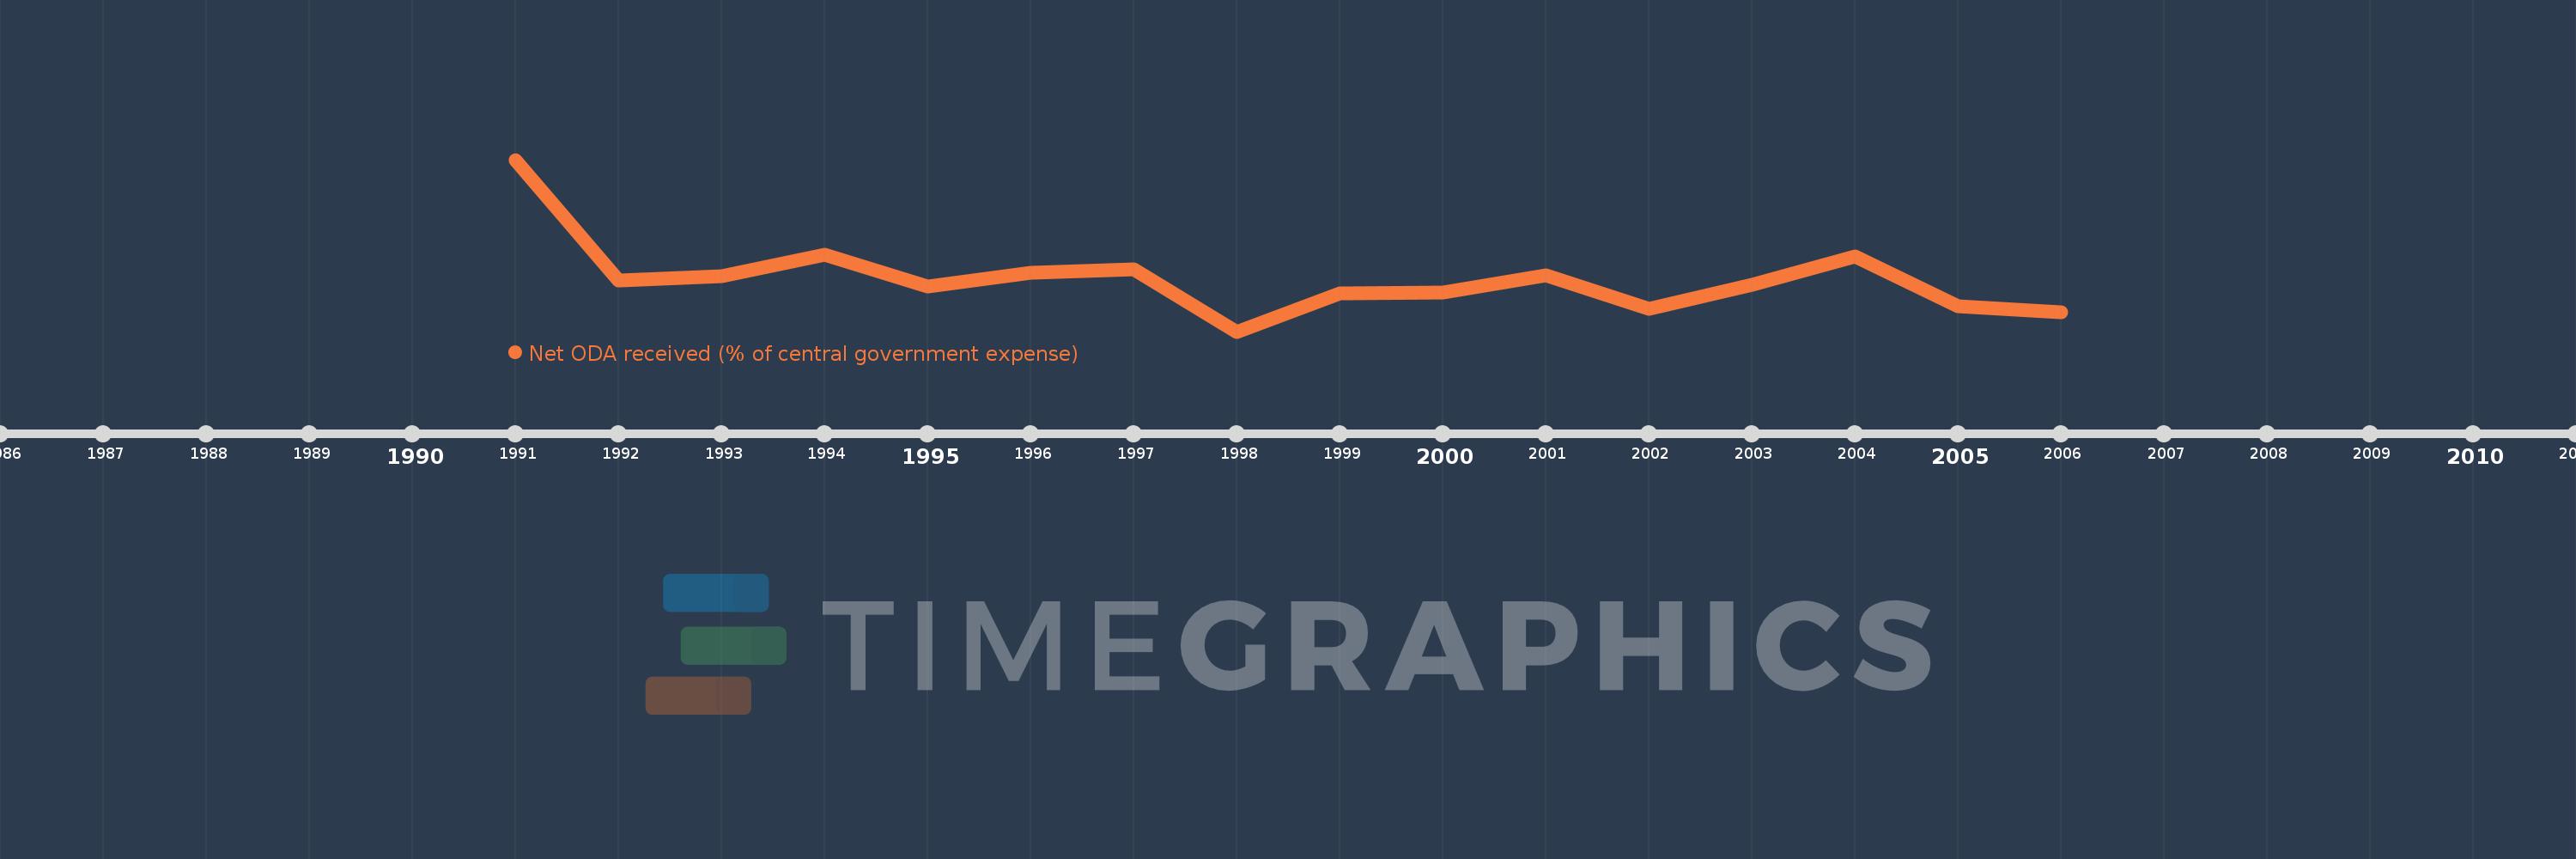
This timeline shows a graph from 1991 to 2006 of Venezuela, RB. No data until 1990. Number of actual observations by date: 16.
Source name:
World Development Indicators
Source organization:
Development Assistance Committee of the Organisation for Economic Co-operation and Development, Geographical Distribution of Financial Flows to Developing Countries, Development Co-operation Report, and International Development Statistics database. Data are available online at: www.oecd.org/dac/stats/idsonline. IMF central government expense estimates are used for the denominator.
Categories, topics:
Aid Effectiveness
Last updated:
apr 23, 2017
Indicators value changes by year
Meaning:
0.286
Minimum:
0.051
jan 1, 1998
Maximum:
0.815
jan 1, 1991
At the date of observation
Value
Absolute change
Change from the previous value
jan 1, 1991
0.815
+0.815
0.0%
jan 1, 1992
0.277
-0.539
-66.07%
jan 1, 1993
0.296
+0.019
6.89%
jan 1, 1994
0.392
+0.096
32.54%
jan 1, 1995
0.253
-0.139
-35.53%
jan 1, 1996
0.313
+0.06
23.87%
jan 1, 1997
0.329
+0.016
5.09%
jan 1, 1998
0.051
-0.278
-84.47%
jan 1, 1999
0.221
+0.169
331.82%
jan 1, 2000
0.226
+0.005
2.48%
jan 1, 2001
0.3
+0.074
32.76%
jan 1, 2002
0.151
-0.149
-49.69%
jan 1, 2003
0.261
+0.11
72.86%
jan 1, 2004
0.386
+0.125
47.77%
jan 1, 2005
0.162
-0.224
-58.08%
jan 1, 2006
0.138
-0.024
-14.68%
Ranking of countries by current statistics by years