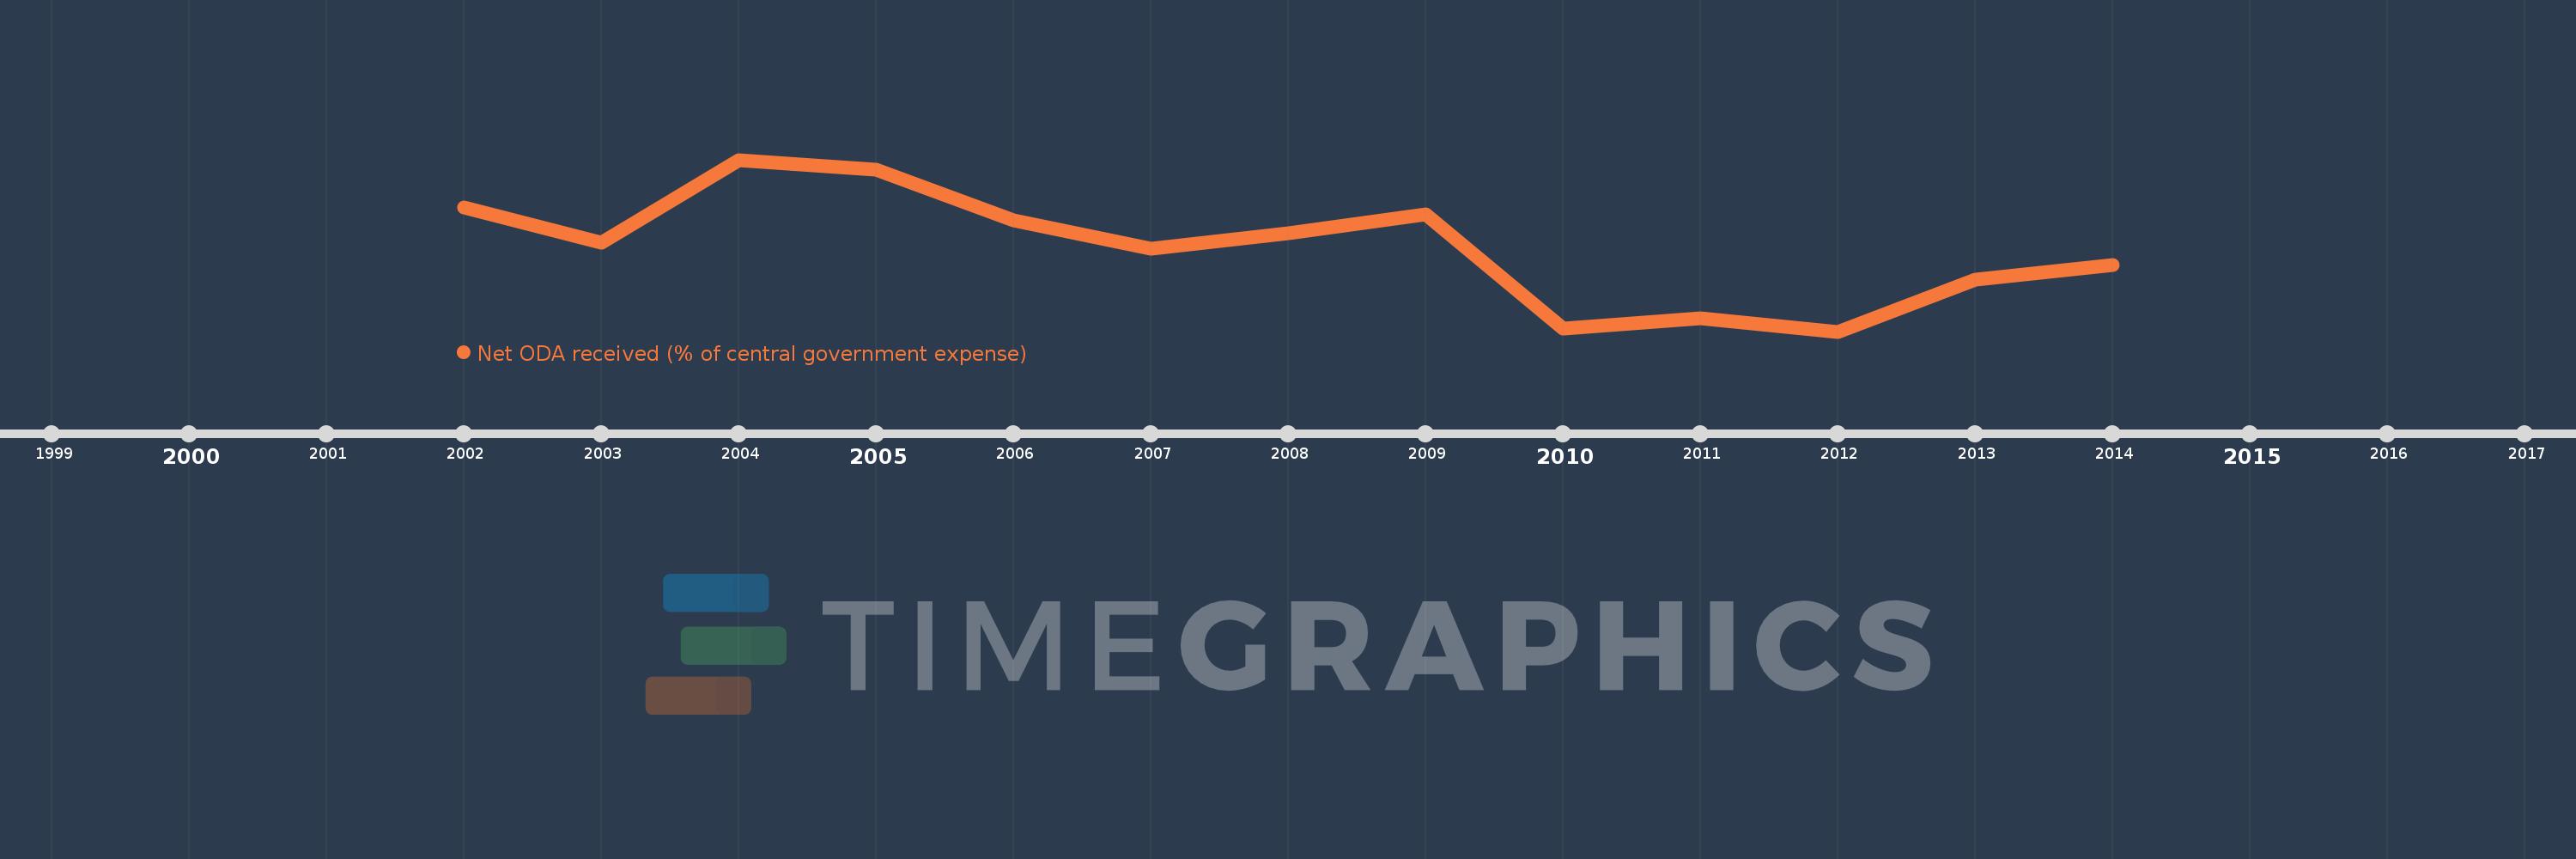
This timeline shows a graph from 2002 to 2014 of Bangladesh. No data until 2001. Number of actual observations by date: 13.
Source name:
World Development Indicators
Source organization:
Development Assistance Committee of the Organisation for Economic Co-operation and Development, Geographical Distribution of Financial Flows to Developing Countries, Development Co-operation Report, and International Development Statistics database. Data are available online at: www.oecd.org/dac/stats/idsonline. IMF central government expense estimates are used for the denominator.
Categories, topics:
Aid Effectiveness
Last updated:
apr 23, 2017
Indicators value changes by year
Meaning:
20.484
Minimum:
11.784
jan 1, 2012
Maximum:
29.59
jan 1, 2004
At the date of observation
Value
Absolute change
Change from the previous value
jan 1, 2002
24.618
+24.618
0.0%
jan 1, 2003
20.997
-3.621
-14.71%
jan 1, 2004
29.59
+8.593
40.93%
jan 1, 2005
28.554
-1.036
-3.5%
jan 1, 2006
23.324
-5.23
-18.32%
jan 1, 2007
20.4
-2.924
-12.53%
jan 1, 2008
21.971
+1.57
7.7%
jan 1, 2009
23.966
+1.996
9.08%
jan 1, 2010
12.117
-11.849
-49.44%
jan 1, 2011
13.143
+1.025
8.46%
jan 1, 2012
11.784
-1.359
-10.34%
jan 1, 2013
17.133
+5.349
45.39%
jan 1, 2014
18.689
+1.556
9.08%
Ranking of countries by current statistics by years