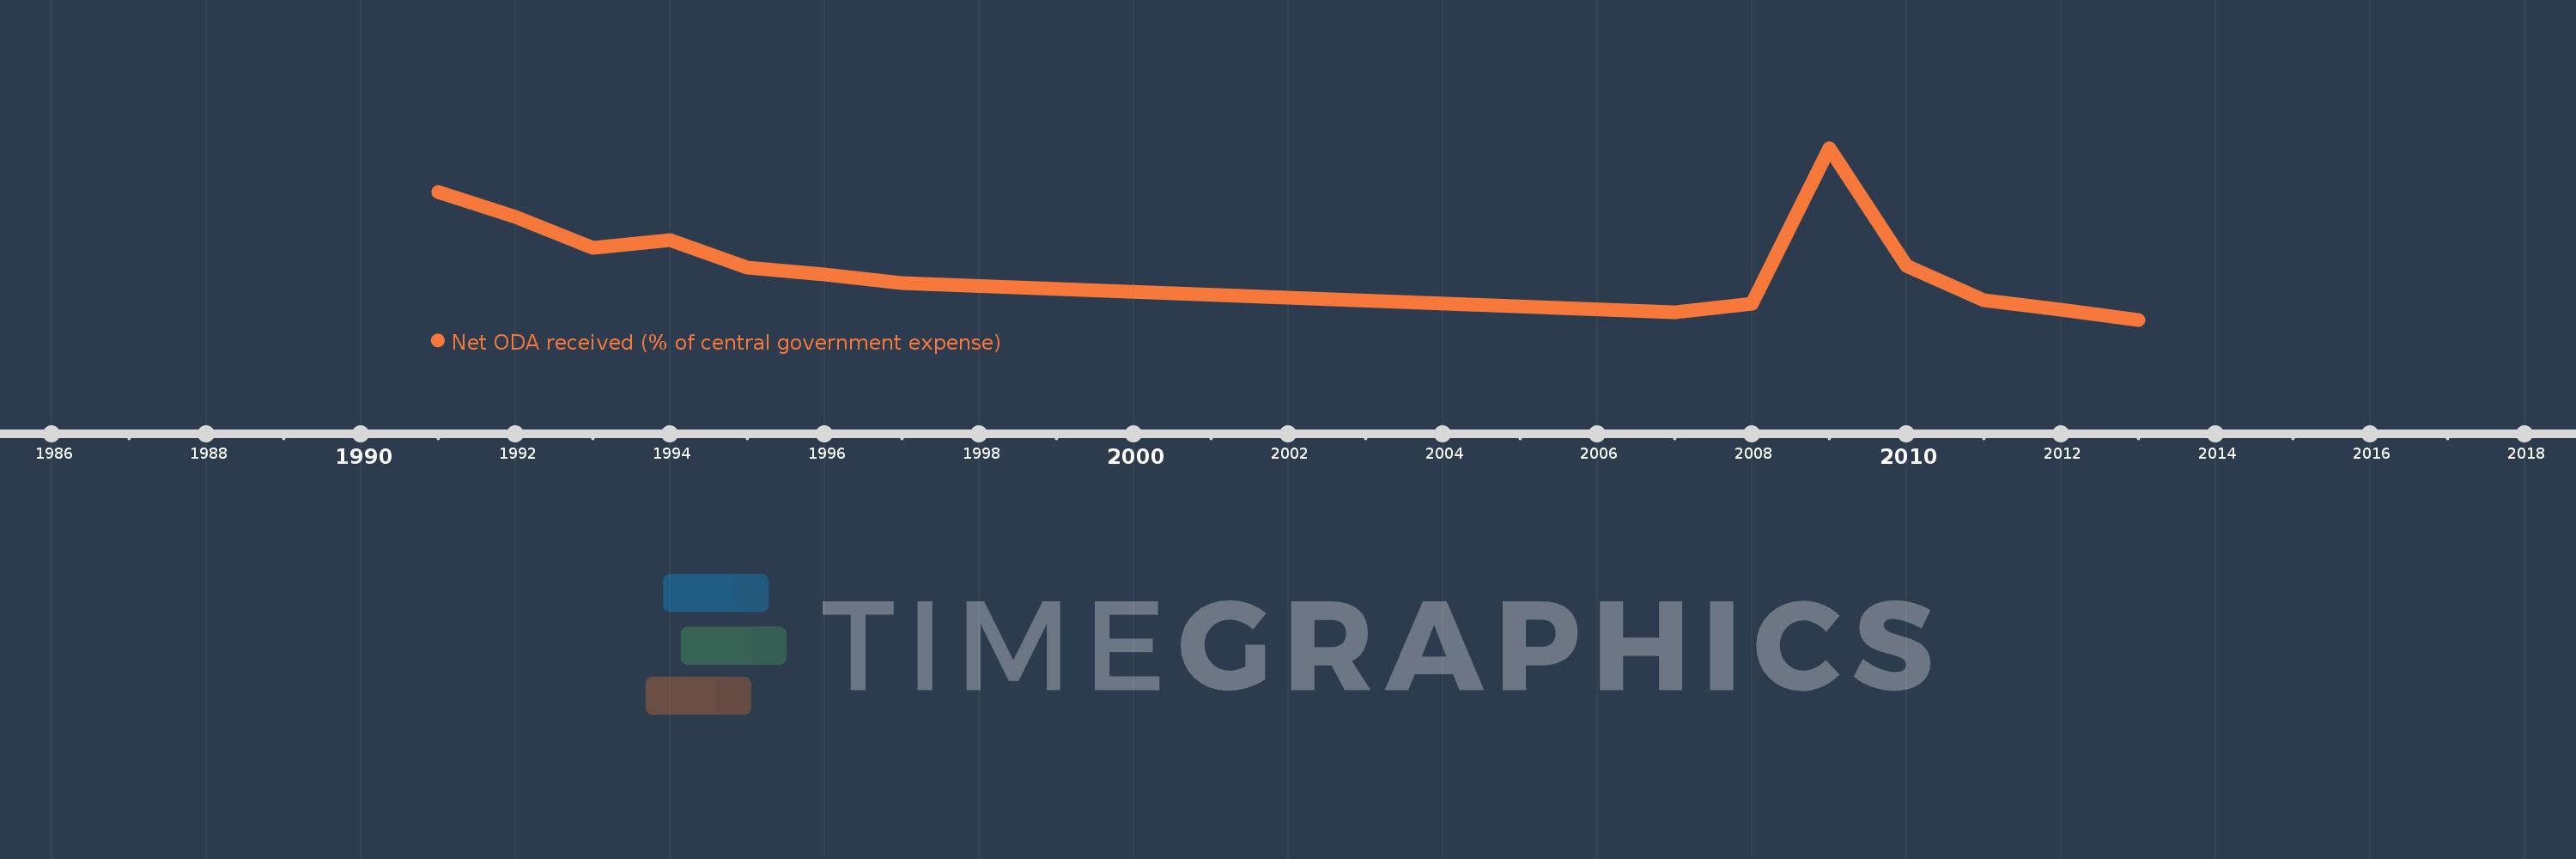
This timeline shows a graph from 1991 to 2013 of Botswana. No data until 1990. Number of actual observations by date: 14.
Source name:
World Development Indicators
Source organization:
Development Assistance Committee of the Organisation for Economic Co-operation and Development, Geographical Distribution of Financial Flows to Developing Countries, Development Co-operation Report, and International Development Statistics database. Data are available online at: www.oecd.org/dac/stats/idsonline. IMF central government expense estimates are used for the denominator.
Categories, topics:
Aid Effectiveness
Last updated:
apr 23, 2017
Indicators value changes by year
Meaning:
7.314
Minimum:
1.658
jan 1, 2013
Maximum:
18.774
jan 1, 2009
At the date of observation
Value
Absolute change
Change from the previous value
jan 1, 1991
14.358
+14.358
0.0%
jan 1, 1992
11.94
-2.418
-16.84%
jan 1, 1993
8.798
-3.143
-26.32%
jan 1, 1994
9.57
+0.772
8.78%
jan 1, 1995
6.878
-2.692
-28.13%
jan 1, 1996
6.181
-0.697
-10.13%
jan 1, 1997
5.303
-0.878
-14.21%
jan 1, 2007
2.367
-2.935
-55.35%
jan 1, 2008
3.271
+0.904
38.17%
jan 1, 2009
18.774
+15.503
473.96%
jan 1, 2010
7.042
-11.732
-62.49%
jan 1, 2011
3.623
-3.419
-48.55%
jan 1, 2012
2.633
-0.991
-27.35%
jan 1, 2013
1.658
-0.975
-37.02%
Ranking of countries by current statistics by years