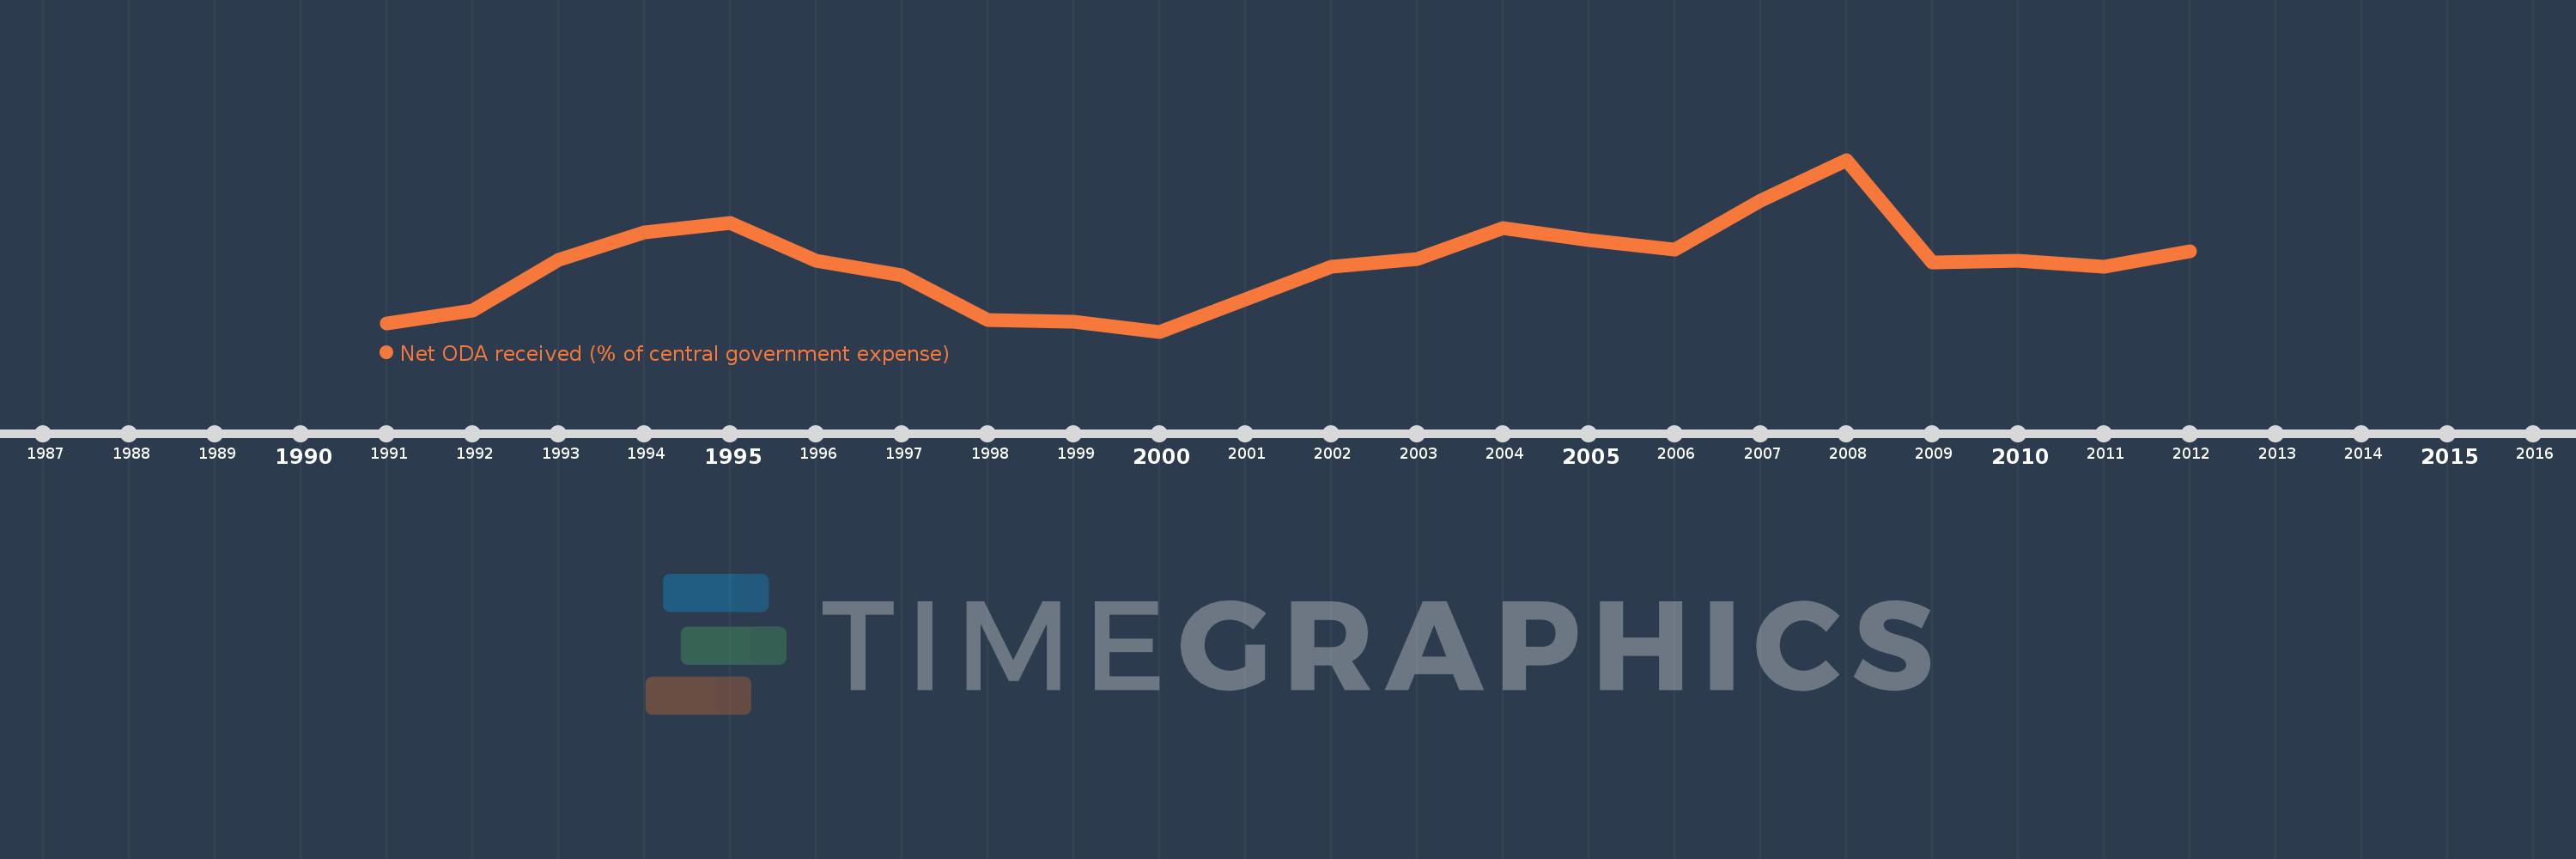
This timeline shows a graph from 1991 to 2012 of Ethiopia. No data until 1990. Number of actual observations by date: 21.
Source name:
World Development Indicators
Source organization:
Development Assistance Committee of the Organisation for Economic Co-operation and Development, Geographical Distribution of Financial Flows to Developing Countries, Development Co-operation Report, and International Development Statistics database. Data are available online at: www.oecd.org/dac/stats/idsonline. IMF central government expense estimates are used for the denominator.
Categories, topics:
Aid Effectiveness
Last updated:
apr 23, 2017
Indicators value changes by year
Meaning:
95.63
Minimum:
45.989
jan 1, 2000
Maximum:
168.745
jan 1, 2008
At the date of observation
Value
Absolute change
Change from the previous value
jan 1, 1991
51.534
+51.534
0.0%
jan 1, 1992
61.089
+9.555
18.54%
jan 1, 1993
97.231
+36.142
59.16%
jan 1, 1994
116.922
+19.691
20.25%
jan 1, 1995
123.358
+6.436
5.5%
jan 1, 1996
96.386
-26.973
-21.87%
jan 1, 1997
86.037
-10.348
-10.74%
jan 1, 1998
54.322
-31.716
-36.86%
jan 1, 1999
52.762
-1.56
-2.87%
jan 1, 2000
45.989
-6.773
-12.84%
jan 1, 2002
92.344
+46.355
100.8%
jan 1, 2003
97.818
+5.475
5.93%
jan 1, 2004
119.645
+21.826
22.31%
jan 1, 2005
111.628
-8.017
-6.7%
jan 1, 2006
104.672
-6.956
-6.23%
jan 1, 2007
139.85
+35.178
33.61%
jan 1, 2008
168.745
+28.895
20.66%
jan 1, 2009
95.496
-73.249
-43.41%
jan 1, 2010
96.872
+1.376
1.44%
jan 1, 2011
92.247
-4.625
-4.77%
jan 1, 2012
103.283
+11.036
11.96%
Ranking of countries by current statistics by years